Demographics
Population Projections: The World’s 6 Largest Countries in 2075
![]() See this visualization first on the Voronoi app.
See this visualization first on the Voronoi app.
Population Projections for the World’s 6 Largest Countries
This was originally posted on our Voronoi app. Download the app for free on Apple or Android and discover incredible data-driven charts from a variety of trusted sources.
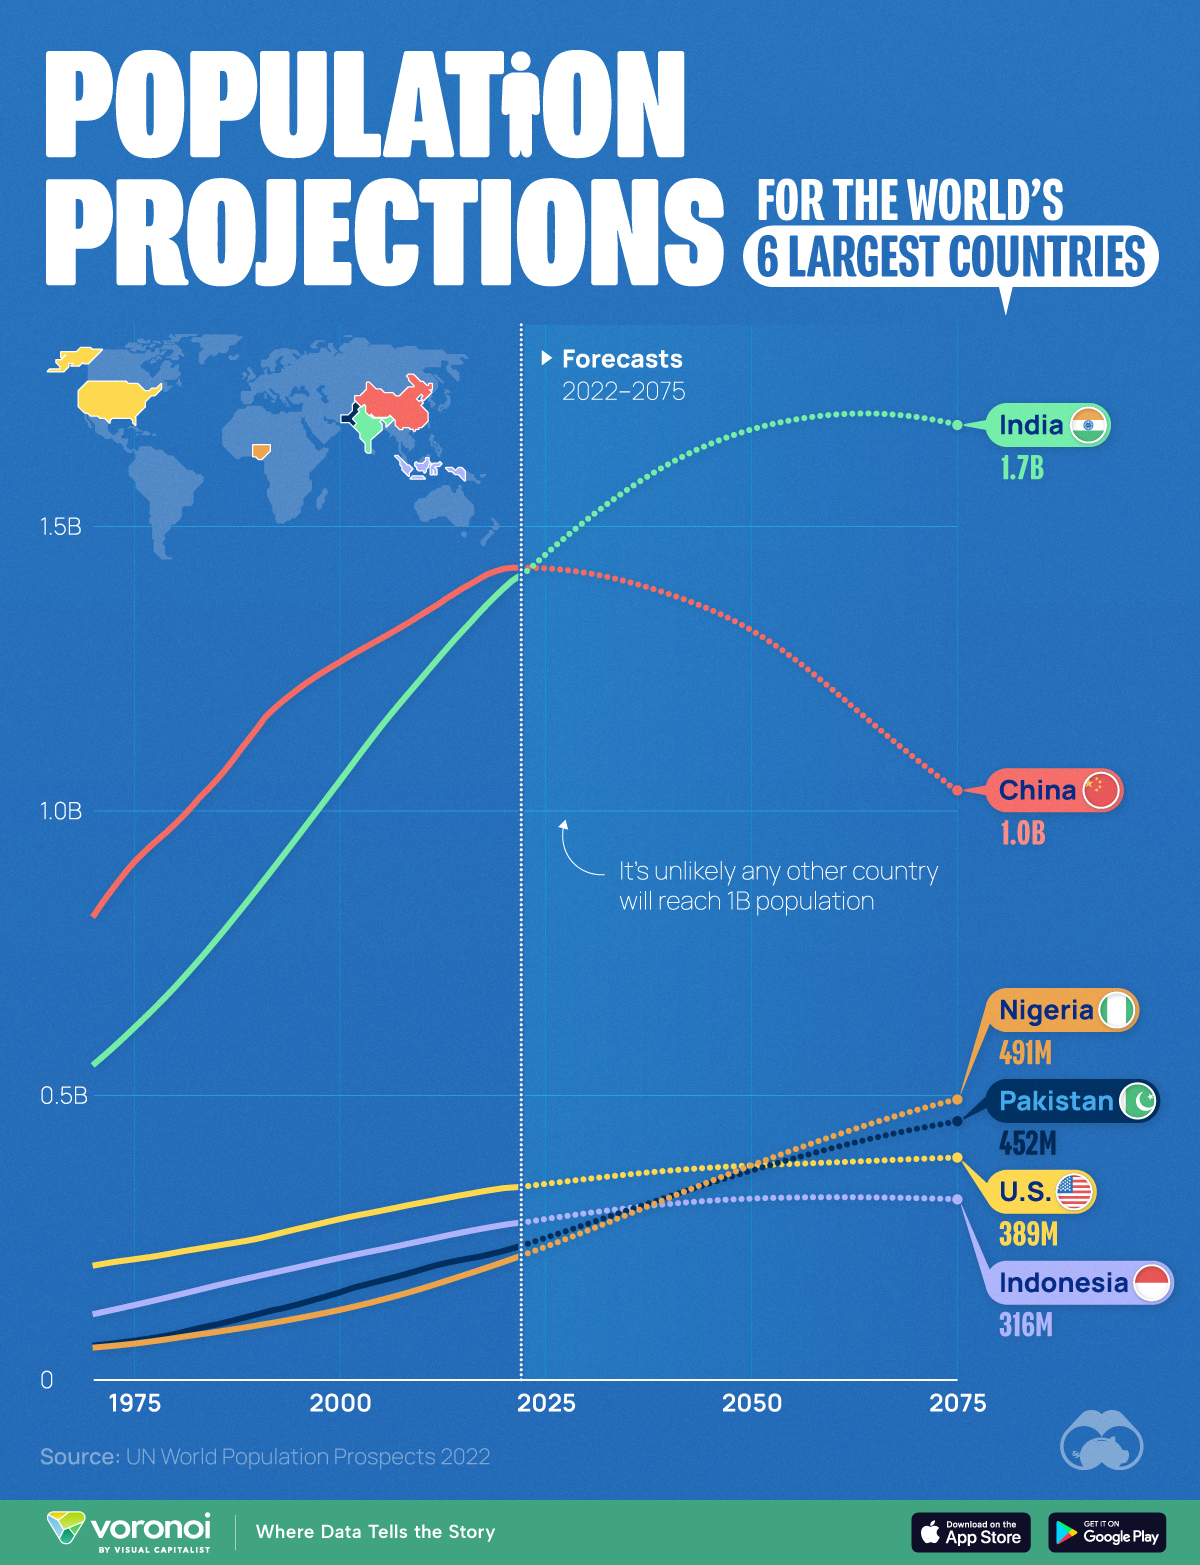
The end of the 21st century will see the first plateauing (and eventually shrinking) of world population since the Industrial Revolution. As birth rates fall across the globe, what does this mean for the world’s most populous countries?
To find out, we visualized forecasts for the world’s six largest countries using data from the latest revised version of the UN World Population Prospects 2022.
Projections are based on a “medium fertility scenario”, which assumes countries will converge at a birth rate of 1.85 children per woman, by 2045-2050.
China’s Projected Population Decline
China’s population boom has officially come to an end, with the country reporting two consecutive years of decreases (down 850,000 in 2022, and 2.1 million in 2023).
| Year | 🇨🇳 China | 🇺🇸 U.S. | 🇮🇩 Indonesia |
|---|---|---|---|
| 1970 | 812M | 199M | 114M |
| 1980 | 975M | 222M | 146M |
| 1990 | 1,144M | 246M | 181M |
| 2000 | 1,260M | 281M | 213M |
| 2010 | 1,344M | 310M | 242M |
| 2020 | 1,424M | 335M | 271M |
| 2030E | 1,417M | 351M | 291M |
| 2040E | 1,380M | 366M | 308M |
| 2050E | 1,317M | 375M | 317M |
| 2060E | 1,211M | 381M | 319M |
| 2070E | 1,091M | 387M | 318M |
| 2075E | 1,035M | 389M | 316M |
Note: Figures are rounded.
The country’s population in 2050 is forecasted to be 1.32 billion, which is roughly the same as it was in 2007. The UN believes this demographic downtrend will accelerate as we enter the second half of the century.
What does this mean for the Chinese economy? Many worry that a smaller workforce, coupled with an aging population, will increase healthcare expenditures and hamper economic growth.
India’s Population Boom Continues
Meanwhile, the UN believes that India’s population will peak somewhere in the mid 2060s, just shy of the 1.7 billion mark.
India’s population will not age as quickly as its neighbor. Those over the age of 65 will represent less than one-fifth of the population until 2060, and their share of India’s total number of people and will not approach 30% until 2100.
| Year | 🇮🇳 India | 🇵🇰 Pakistan | 🇳🇬 Nigeria |
|---|---|---|---|
| 1970 | 551M | 58M | 55M |
| 1980 | 689M | 79M | 72M |
| 1990 | 861M | 114M | 94M |
| 2000 | 1,050M | 152M | 121M |
| 2010 | 1,232M | 192M | 159M |
| 2020 | 1,390M | 225M | 206M |
| 2030E | 1,509M | 272M | 260M |
| 2040E | 1,608M | 320M | 318M |
| 2050E | 1,668M | 366M | 375M |
| 2060E | 1,695M | 406M | 427M |
| 2070E | 1,691M | 439M | 472M |
| 2075E | 1,678M | 452M | 491M |
Note: Figures are rounded.
Finally, whether these predictions come true or not will depend on how quickly birth rates fall as the country develops. For example, India’s fertility rate fell from 6.2 in 1950, to 2.0 in 2021 (births per woman).


Demographics
Charted: EU Emigrants by Country
EU emigration patterns don’t see the spotlight as often as its immigration numbers. So, here are the top source countries for EU emigrants.

Charted: EU Emigrants by Country
This was originally posted on our Voronoi app. Download the app for free on iOS or Android and discover incredible data-driven charts from a variety of trusted sources.
Immigration into the EU has been a hot topic since 2011. In fact, in several EU countries, immigrants make up nearly one-fifth of the population. But what of the EU’s emigration patterns?
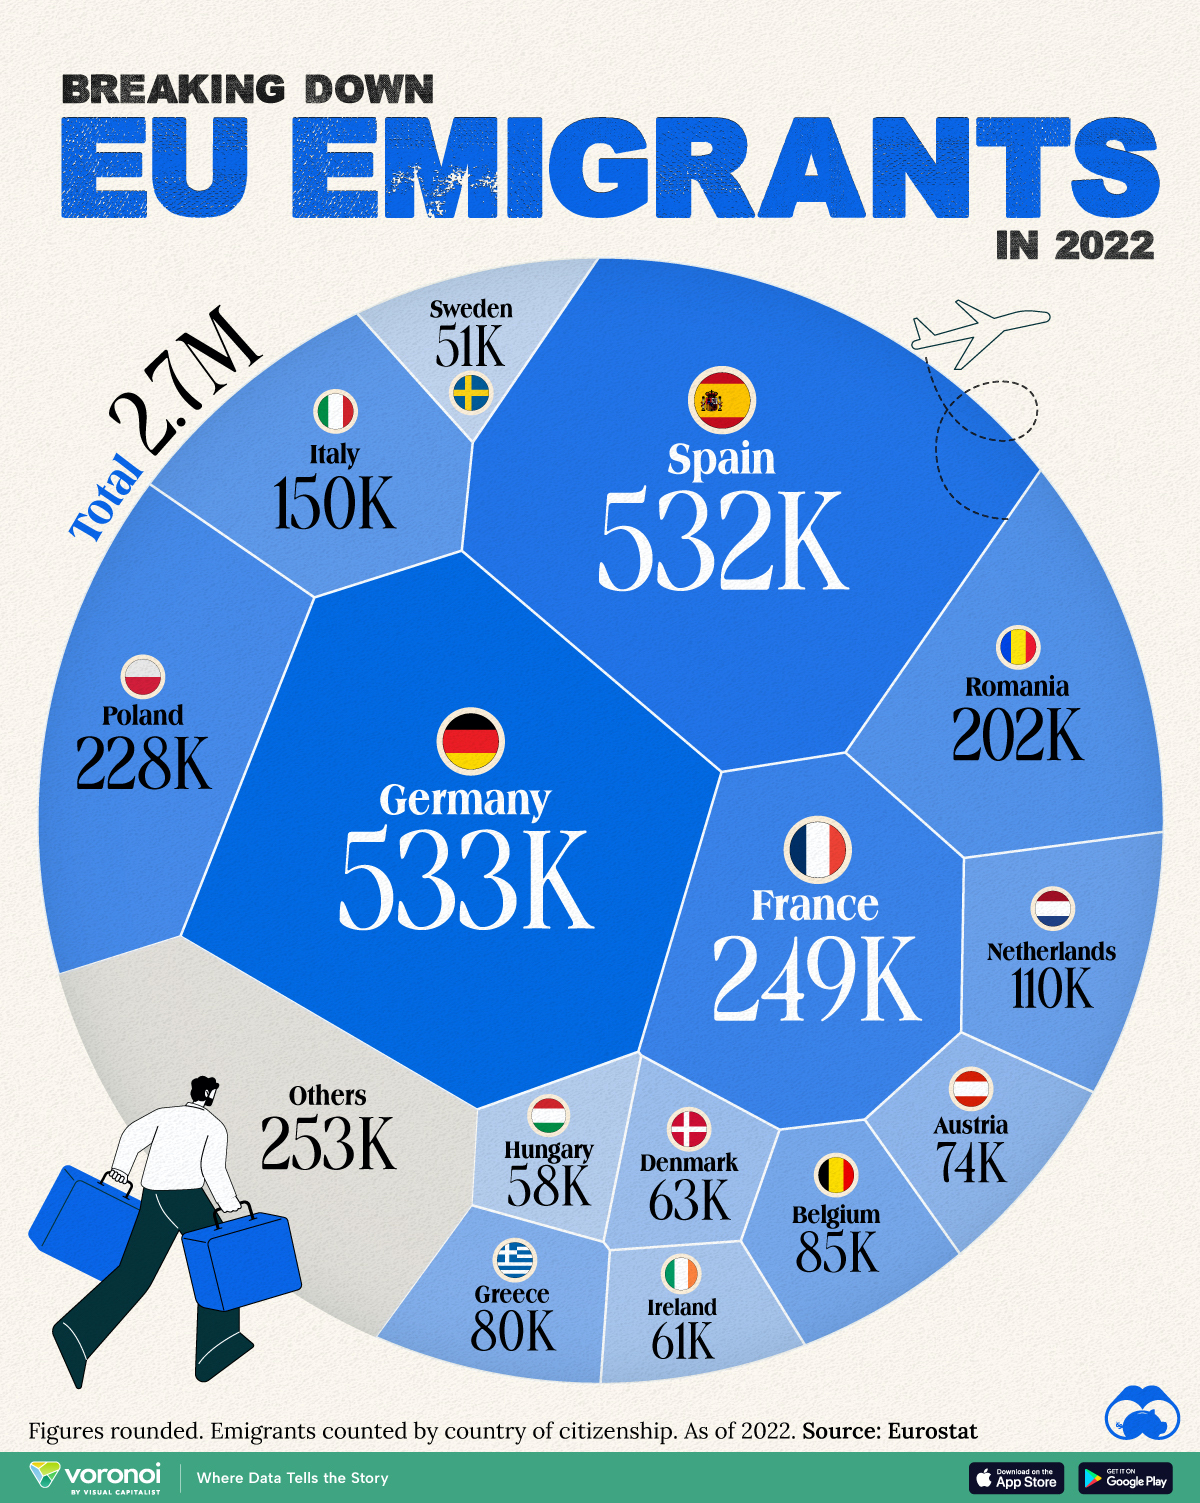
We chart out the number of EU emigrants by their country of citizenship in 2022. Data for this visualization is sourced from Eurostat.
Which EU Country Had the Most Emigrants in 2022?
Germany and Spain had the highest number of emigrants in the EU in 2022, both measuring more than half a million people.
Interestingly, while German emigrants prefer moving to Switzerland and Austria, Spanish migrants often end up in Germany.
Here’s a full list of 27 EU member states and their emigration numbers in 2022, both as number of people and as a percentage of the population. Data for Switzerland, Norway, and Liechtenstein has also been included for context, but is not part of the visualization, nor contributes to the overall EU number.
| Rank | Country | Emigrants (2022) | % of Population (2022) |
|---|---|---|---|
| 1 | 🇩🇪 Germany | 533,485 | 0.64% |
| 2 | 🇪🇸 Spain | 531,889 | 1.11% |
| 3 | 🇫🇷 France | 249,355 | 0.37% |
| 4 | 🇵🇱 Poland | 228,006 | 0.62% |
| 5 | 🇷🇴 Romania | 202,311 | 1.06% |
| 6 | 🇮🇹 Italy | 150,189 | 0.25% |
| 7 | 🇨🇭 Switzerland* | 122,123 | 1.39% |
| 8 | 🇳🇱 Netherlands | 109,616 | 0.62% |
| 9 | 🇧🇪 Belgium | 84,627 | 0.72% |
| 10 | 🇬🇷 Greece | 80,307 | 0.77% |
| 11 | 🇦🇹 Austria | 74,271 | 0.82% |
| 12 | 🇩🇰 Denmark | 62,927 | 1.07% |
| 13 | 🇮🇪 Ireland | 61,133 | 1.19% |
| 14 | 🇭🇺 Hungary | 58,408 | 0.61% |
| 15 | 🇸🇪 Sweden | 50,592 | 0.48% |
| 16 | 🇭🇷 Croatia | 46,287 | 1.20% |
| 17 | 🇳🇴 Norway* | 32,536 | 0.60% |
| 18 | 🇨🇿 Czech Republic | 31,764 | 0.30% |
| 19 | 🇵🇹 Portugal | 30,954 | 0.30% |
| 20 | 🇸🇮 Slovenia | 20,956 | 0.99% |
| 21 | 🇨🇾 Cyprus | 17,958 | 1.43% |
| 22 | 🇱🇺 Luxembourg | 17,227 | 2.64% |
| 23 | 🇱🇻 Latvia | 16,680 | 0.89% |
| 24 | 🇫🇮 Finland | 15,635 | 0.28% |
| 25 | 🇱🇹 Lithuania | 15,270 | 0.54% |
| 26 | 🇧🇬 Bulgaria | 13,175 | 0.20% |
| 27 | 🇲🇹 Malta | 13,166 | 2.48% |
| 28 | 🇪🇪 Estonia | 9,657 | 0.72% |
| 29 | 🇸🇰 Slovakia | 4,468 | 0.08% |
| 30 | 🇱🇮 Liechtenstein* | 480 | 1.22% |
| N/A | 🇪🇺 EU | 2,730,313 | 0.61% |
*Not in the EU, but part of the European Free Trade Area or the European Economic area. Emigrants counted by country of citizenship, not birth.
As a percentage of the population, Malta and Luxembourg had slightly more than 2% of their 2022 populations emigrate.
Across the EU, almost 3 million people left their countries of citizenship in 2022. About half of them moved between member states and 1 million left the union all together.
For comparison, slightly more than 5 million people immigrated into the union in the same year. The top three destination countries were the same as the top three by emigrants: Germany, Spain, and France.
Immigration is seen as a way for aging countries to boost their workforce numbers and bring down their old-age dependency ratio. However, per Eurostat’s estimates, current immigration into the EU will not reverse aging trends.

-

 Technology6 days ago
Visualizing the Training Costs of AI Models Over Time
-

 Education2 weeks ago
How U.S. College Students Feel About Their Finances
-

 Technology2 weeks ago
What Laptop Brands do Americans Use in 2024?
-

 Maps2 weeks ago
Mapped: Chinese Provinces With Cities Over 1 Million People
-

 Best of2 weeks ago
Best Visualizations of May on the Voronoi App
-

 Crime2 weeks ago
Visualizing the Companies Online Scammers Impersonate the Most
-

 Stocks1 week ago
Comparing Saudi Aramco’s $1.9T Valuation to Its Rivals
-

 Mining1 week ago
Visualizing Cobalt Production by Country in 2023