Demographics
Ranked: Countries Where Youth are the Most Unhappy, Relative to Older Generations
![]() See this visualization first on the Voronoi app.
See this visualization first on the Voronoi app.
Countries with the Biggest Happiness Gaps Between Generations
This was originally posted on our Voronoi app. Download the app for free on iOS or Android and discover incredible data-driven charts from a variety of trusted sources.
“They say a person needs just three things to be truly happy in this world: someone to love, something to do, and something to hope for.” — Tom Bodett
Measuring happiness is tricky business, more so when taking into account how different regions, cultures, and faiths define it. Nevertheless, the World Happiness Report attempts to distill being happy into a single score out of 10, and then ranks countries by their average score.
We’ve visualized the high-level findings from the latest happiness report in this series of maps. However, the report also dives deeper into other significant trends in the data, such as a growing disparity in happiness between age groups within countries themselves.
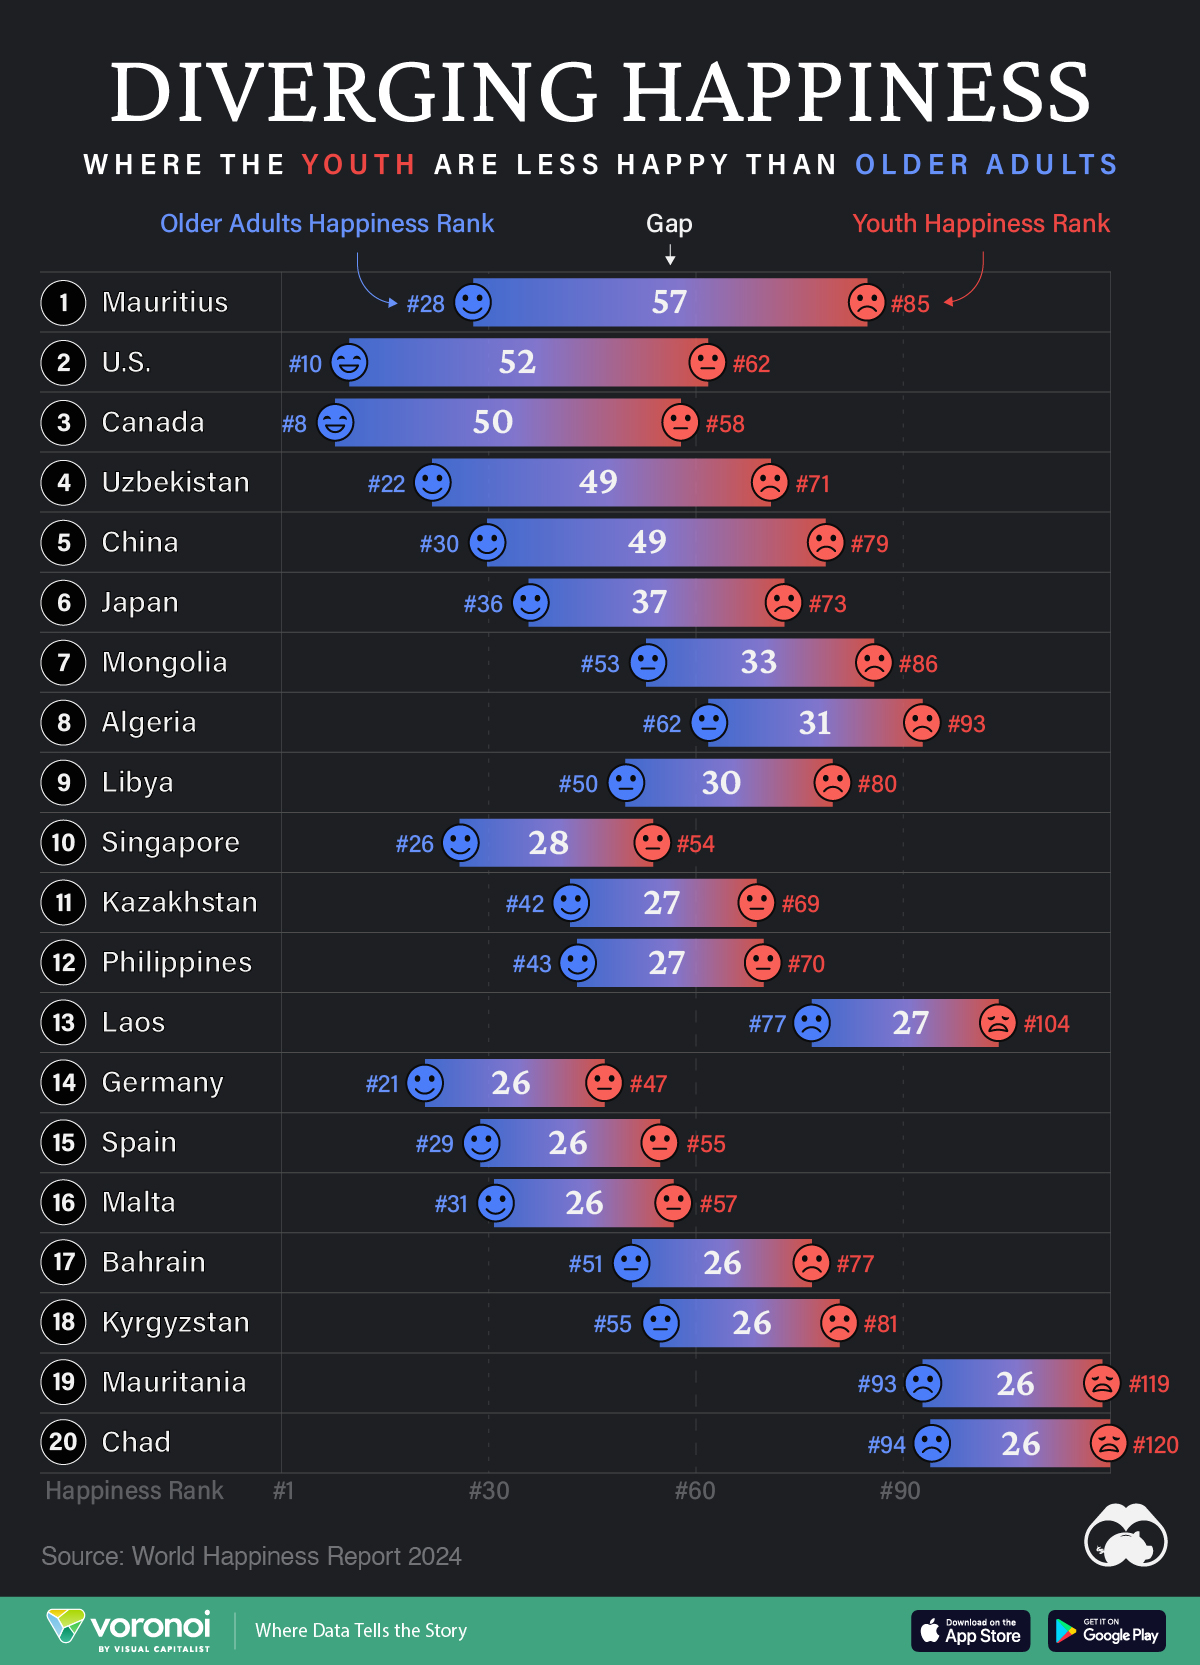
In the chart above, we list countries by the biggest gaps in happiness ranks between young adults (<30) and older adults (60+). A higher number indicates a larger gap, and that the youth are far unhappier than their older counterparts.
Where are Youth Unhappier than Older Adults?
Mauritius ranks first on this list, with a massive 57 place gap between older adult and youth happiness. The 1.26 million-inhabited island nation briefly reached high income status in 2020, but the pandemic hit hard, hurting its key tourism sector, and affecting jobs.
The country’s youth unemployment rate spiked to close to 25% that year, but has since been on the decline. Like residents on many similarly-populated islands, the younger demographic often moves abroad in search of more opportunities.
| Rank | Country | Youth Happiness Rank | Older Adult Happiness Rank | Happiness Gap |
|---|---|---|---|---|
| 1 | 🇲🇺 Mauritius | 85 | 28 | 57 |
| 2 | 🇺🇸 U.S. | 62 | 10 | 52 |
| 3 | 🇨🇦 Canada | 58 | 8 | 50 |
| 4 | 🇺🇿 Uzbekistan | 71 | 22 | 49 |
| 5 | 🇨🇳 China | 79 | 30 | 49 |
| 6 | 🇯🇵 Japan | 73 | 36 | 37 |
| 7 | 🇲🇳 Mongolia | 86 | 53 | 33 |
| 8 | 🇩🇿 Algeria | 93 | 62 | 31 |
| 9 | 🇱🇾 Libya | 80 | 50 | 30 |
| 10 | 🇸🇬 Singapore | 54 | 26 | 28 |
| 11 | 🇰🇿 Kazakhstan | 69 | 42 | 27 |
| 12 | 🇵🇭 Philippines | 70 | 43 | 27 |
| 13 | 🇱🇦 Laos | 104 | 77 | 27 |
| 14 | 🇩🇪 Germany | 47 | 21 | 26 |
| 15 | 🇪🇸 Spain | 55 | 29 | 26 |
| 16 | 🇲🇹 Malta | 57 | 31 | 26 |
| 17 | 🇧🇭 Bahrain | 77 | 51 | 26 |
| 18 | 🇰🇬 Kyrgyzstan | 81 | 55 | 26 |
| 19 | 🇲🇷 Mauritania | 119 | 93 | 26 |
| 20 | 🇹🇩 Chad | 120 | 94 | 26 |
Conventional wisdom says, and data somewhat correlates, that young adults (those below 30) tend to be the happiest demographic. Happiness then decreases through middle age and starts increasing around 60. However, the above countries are digressing from the pattern, with older generations being much happier than young adults.
That older generations are happier, by itself, is not a bad thing. However, that younger adults are so much unhappier in the same country can point to several unique stresses that those aged below 30 are facing.
For example, in the U.S. and Canada—both near the top of this list—many young adults feel like they have been priced out of owning a home: a once key metric of success.
Climate anxieties are also high, with worries about the future of the world they’ll inhabit. Finally, persistent economic inequities are also weighing on the younger generation, with many in that cohort feeling like they will never be able to afford to retire.
All of this comes alongside a rising loneliness epidemic, where those aged 18–25 report much higher rates of loneliness than the general population.
Source: The World Happiness Report which leverages data from the Gallup World Poll.
Methodology: A nationally representative group of approximately 1,000 people per country are asked to evaluate their life on a scale of 0–10. Scores are averaged across generations per country over three years. Countries are ranked by their scores out of 10.


Jobs
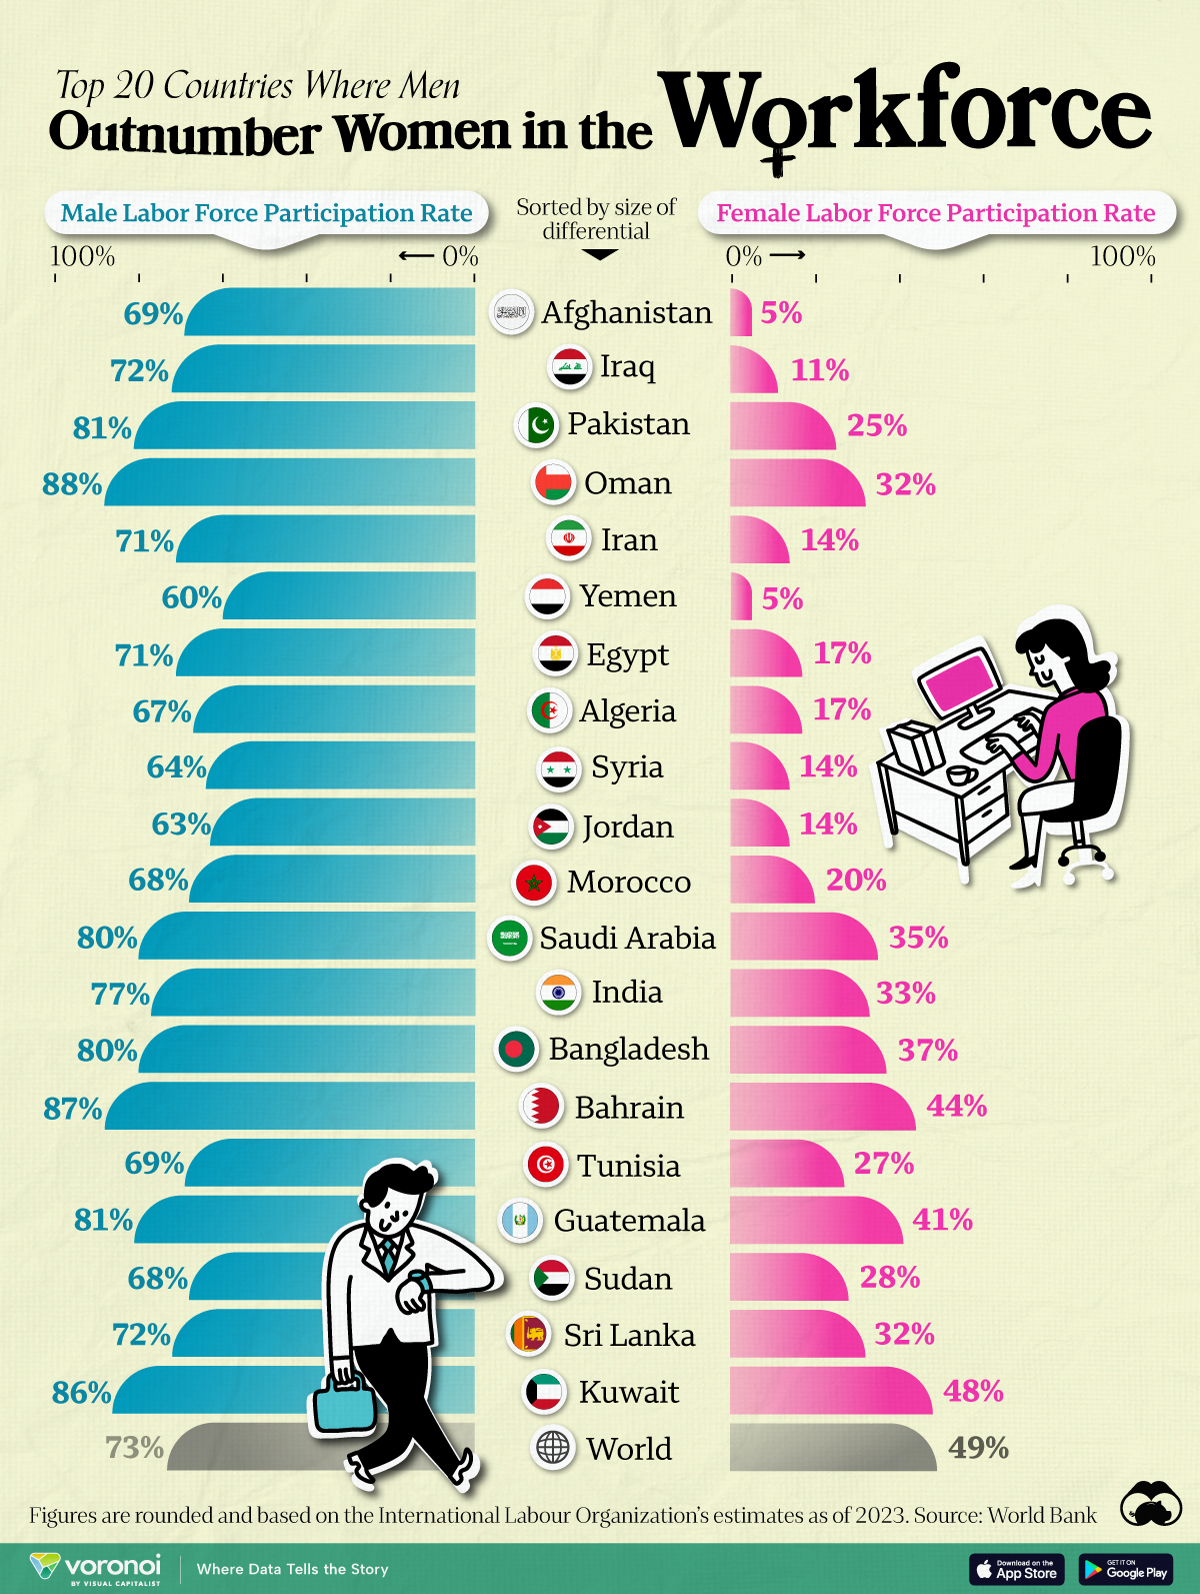
Countries with the Biggest Gender Disparities in their Workforces
Tracking the difference between male and female labor force participation rates reveals large gender disparities for women at work.

Countries with the Biggest Gender Disparities in Workforces
This was originally posted on our Voronoi app. Download the app for free on iOS or Android and discover incredible data-driven charts from a variety of trusted sources.
This graphic ranks the countries with the biggest gender disparities in their labor forces by contrasting the average male and female labor force participation rate and measuring the gap between them.
Data for this graphic is sourced from the World Bank, which aggregates 2023 International Labour Organization estimates.
Ranked: Differences in Male and Female Labor Participation Rates
The top 10 countries with the highest discrepancies between male and female labor participation rates are Islamic nations:
| Rank | Country | Male Labor Force Participation Rate (%) | Female Labor Force Participation Rate (%) | Gender Disparity (In percentage points) |
|---|---|---|---|---|
| 1 | 🇦🇫 Afghanistan | 69 | 5 | 64 |
| 2 | 🇮🇶 Iraq | 72 | 11 | 61 |
| 3 | 🇵🇰 Pakistan | 81 | 25 | 57 |
| 4 | 🇴🇲 Oman | 88 | 32 | 56 |
| 5 | 🇮🇷 Iran | 71 | 14 | 56 |
| 6 | 🇾🇪 Yemen | 60 | 5 | 55 |
| 7 | 🇪🇬 Egypt | 71 | 17 | 55 |
| 8 | 🇩🇿 Algeria | 67 | 17 | 50 |
| 9 | 🇸🇾 Syria | 64 | 14 | 50 |
| 10 | 🇯🇴 Jordan | 63 | 14 | 49 |
| 11 | 🇲🇦 Morocco | 68 | 20 | 49 |
| 12 | 🇸🇦 Saudi Arabia | 80 | 35 | 45 |
| 13 | 🇮🇳 India | 77 | 33 | 44 |
| 14 | 🇧🇩 Bangladesh | 80 | 37 | 43 |
| 15 | 🇧🇭 Bahrain | 87 | 44 | 43 |
| 16 | 🇹🇳 Tunisia | 69 | 27 | 42 |
| 17 | 🇬🇹 Guatemala | 81 | 41 | 40 |
| 18 | 🇸🇩 Sudan | 68 | 28 | 40 |
| 19 | 🇱🇰 Sri Lanka | 72 | 32 | 40 |
| 20 | 🇰🇼 Kuwait | 86 | 48 | 38 |
| N/A | 🌍 World | 73 | 49 | 24 |
Note: Figures rounded and based on International Labour Organization’s estimates as of 2023.
In countries such as Pakistan, Oman, and Saudi Arabia, the male labor force participation rates are higher than the global average. Meanwhile the female participation rates are 50+ percentage points lower than the corresponding male rates, and 15-25 points below the global female average.
For the other countries in the top 10 by labor participation rate differential, the average male participation rate is also below the global average. This could indicate a lack of general economic opportunities with the nation.
Finally, India (#13), Guatemala (#17) and Sri Lanka (#19) are three countries in the top 20 with a non-Islamic majority population.

-

 Cryptocurrency5 days ago
Visualizing the 15 Most Valuable Bitcoin Addresses
-
 Crime2 weeks ago
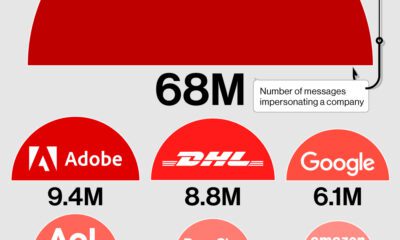
Visualizing the Companies Online Scammers Impersonate the Most
-
 Markets2 weeks ago
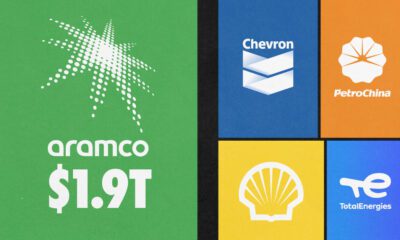
Comparing Saudi Aramco’s $1.9T Valuation to Its Rivals
-
 Mining2 weeks ago
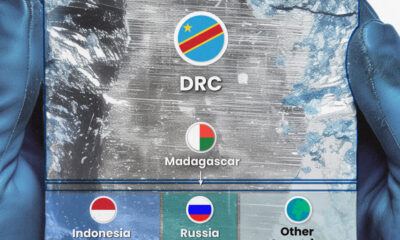
Visualizing Cobalt Production by Country in 2023
-
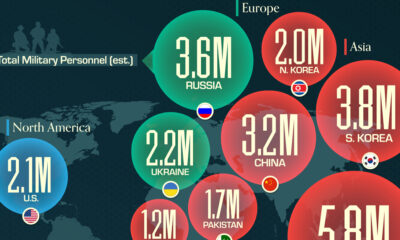
 War2 weeks ago
Mapped: The World’s Largest Armies in 2024
-
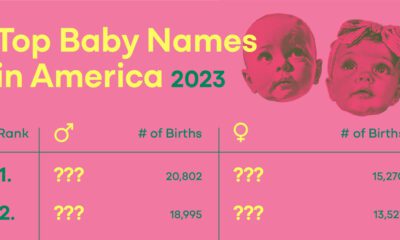
 Gen Z1 week ago
Charted: America’s Most Popular Baby Names in 2023
-
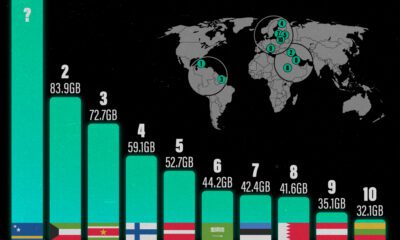
 Technology1 week ago
Visualizing the Top Countries, by Mobile Data Usage
-

 Environment1 week ago
Ranked: Top 10 Deadliest Animals for Humans