:format(webp)/cdn.vox-cdn.com/uploads/chorus_image/image/35252046/3748516748_6f41098441_b.0.jpg)
When droughts or crop failures cause food prices to spike, many Americans hardly notice. The average American, after all, spends just 6.5 percent of his or her household budget on food consumed at home. (If you include eating out, that rises to around 11 percent.)
In Pakistan, by contrast, the average person spends 41.4 percent of his or her household budget on food consumed at home. In that situation, those price spikes become a lot more noticeable.
The US Department of Agriculture's Economic Research Service keeps tabs on household expenditures for food, alcohol, and tobacco around the world.
Americans, it turns out, spend a smaller share of their household budgets on food than anyone else — less even than Canadians or Europeans or Australians:
:format(webp):no_upscale()/cdn.vox-cdn.com/uploads/chorus_asset/file/3969026/food_spending_global__2014.0.png)
Note that the map above is based on data for food consumed at home — the USDA doesn't offer international comparisons for eating out, unfortunately. Still, even if you do include food consumed at restaurants, Americans devote just 11 percent of their household spending to food, a smaller share than nearly every other country spends on food consumed at home alone.
Below is a chart showing percentages for a handful of select countries. This doesn't include spending on government subsidies or anything like that — it's just a measure of the fraction of household expenditures devoted to food consumed at home:
:format(webp):no_upscale()/cdn.vox-cdn.com/uploads/chorus_asset/file/3969046/food_spending__select_countries_2014.0.png)
Now, to clarify, these are percentages. In an absolute sense, the United States spends more per household on food consumed at home ($2,390 per year) than, say, Nigeria ($1,343) or Russia ($1,935). But because Americans are richer, food still makes up a much smaller portion of their budgets.
Anyway, there are a few basic takeaways here:
1) Richer countries spend a smaller fraction of their income on food. This makes intuitive sense. There's an upper limit on how much food a person can physically eat. So as countries get richer, they start spending more of their money on other things — like health care, or entertainment, or alcohol. South Koreans spent one-third of their budget on food in 1975; today that's down to just 13 percent.
That said, this relationship doesn't always hold. It depends, at least in part, on what kind of food people favor, patterns of eating out, and the specific food prices and subsidy schemes in their country. Note that India spends a smaller fraction of its budget on food consumed at home than Russia, which is much richer. Likewise, South Korea spends a smaller share of its budget on food than wealthier Japan does.
2) Americans spend less than Europeans on food at home. The fact that Americans spend a smaller portion of their household budgets on food than Europeans is partly a consequence of the fact that Americans are richer. But Americans spend less on an absolute level, too.
The average American household spends $2,390 per year on food consumed at home, the USDA notes. The average German household spends $2,646 per year. The average French household spends $3,241 per year. The average Norwegian spends a whopping $4,454 per year on food.
The USDA doesn't explain the variation. Some of it likely has to do with different tax systems in Europe (here's an international comparison of food prices), as well as differences in eating out. But there are also dozens of forces making food in the United States cheap — from farm subsidies to advancements in industrial agriculture that have pushed down the price of food. (Over the years, the price of meat, poultry, sweets, fats, and oils in the United States have fallen, although the price of fresh produce has risen.)
There are fierce debates about the downsides of industrial agriculture — as well as the desirability of subsidizing agriculture. But one thing this system has done fairly well is keep the sticker price of food at the grocery store down.
3) High spending on food and malnutrition seem to go hand in hand. This is another perhaps obvious point, but worth highlighting. Poorer countries that have to spend a much larger share of their budget on food also end up with much higher malnutrition rates.
Here's an older map from Washington State University making this point (click to enlarge, although note the date is from 2008):
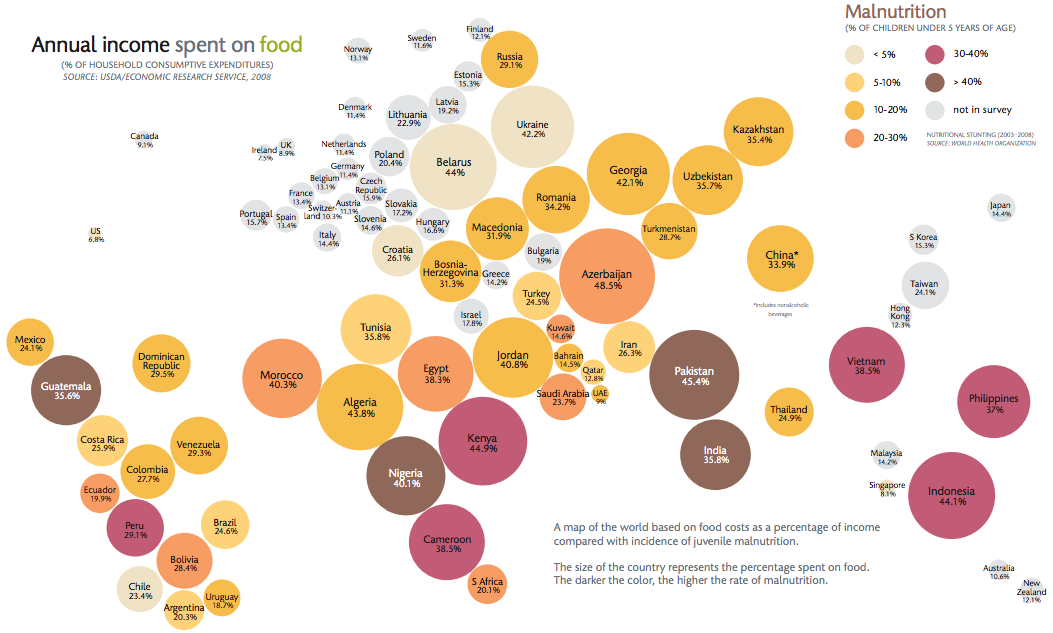
(Washington State University)
You can find the USDA's data on international food expenditures in this spreadsheet. (Note that there's also data on alcohol and tobacco spending — the Czech Republic comes out on top here, spending 9.3 percent of expenditures on booze and cigarettes.)
Further reading: 40 maps that explain food in America