Business
Where Are the Oldest Companies in Existence?
View the full-size version of this infographic.
Where Are the Oldest Companies in Existence?
View the high resolution version of this infographic by clicking here.
In just a few decades, it’s possible that some of today’s most recognized companies may no longer be household names.
Corporate longevity, or the average lifespan of a company, has been shrinking dramatically.
In the 1960s, a typical S&P 500 company was projected to last for more than 60 years. However, with the rapidly transforming business landscape today, it’s down to just 18 years.
The Companies With the Strongest Staying Power
Even with companies skewing younger, there are always exceptions to the rule.
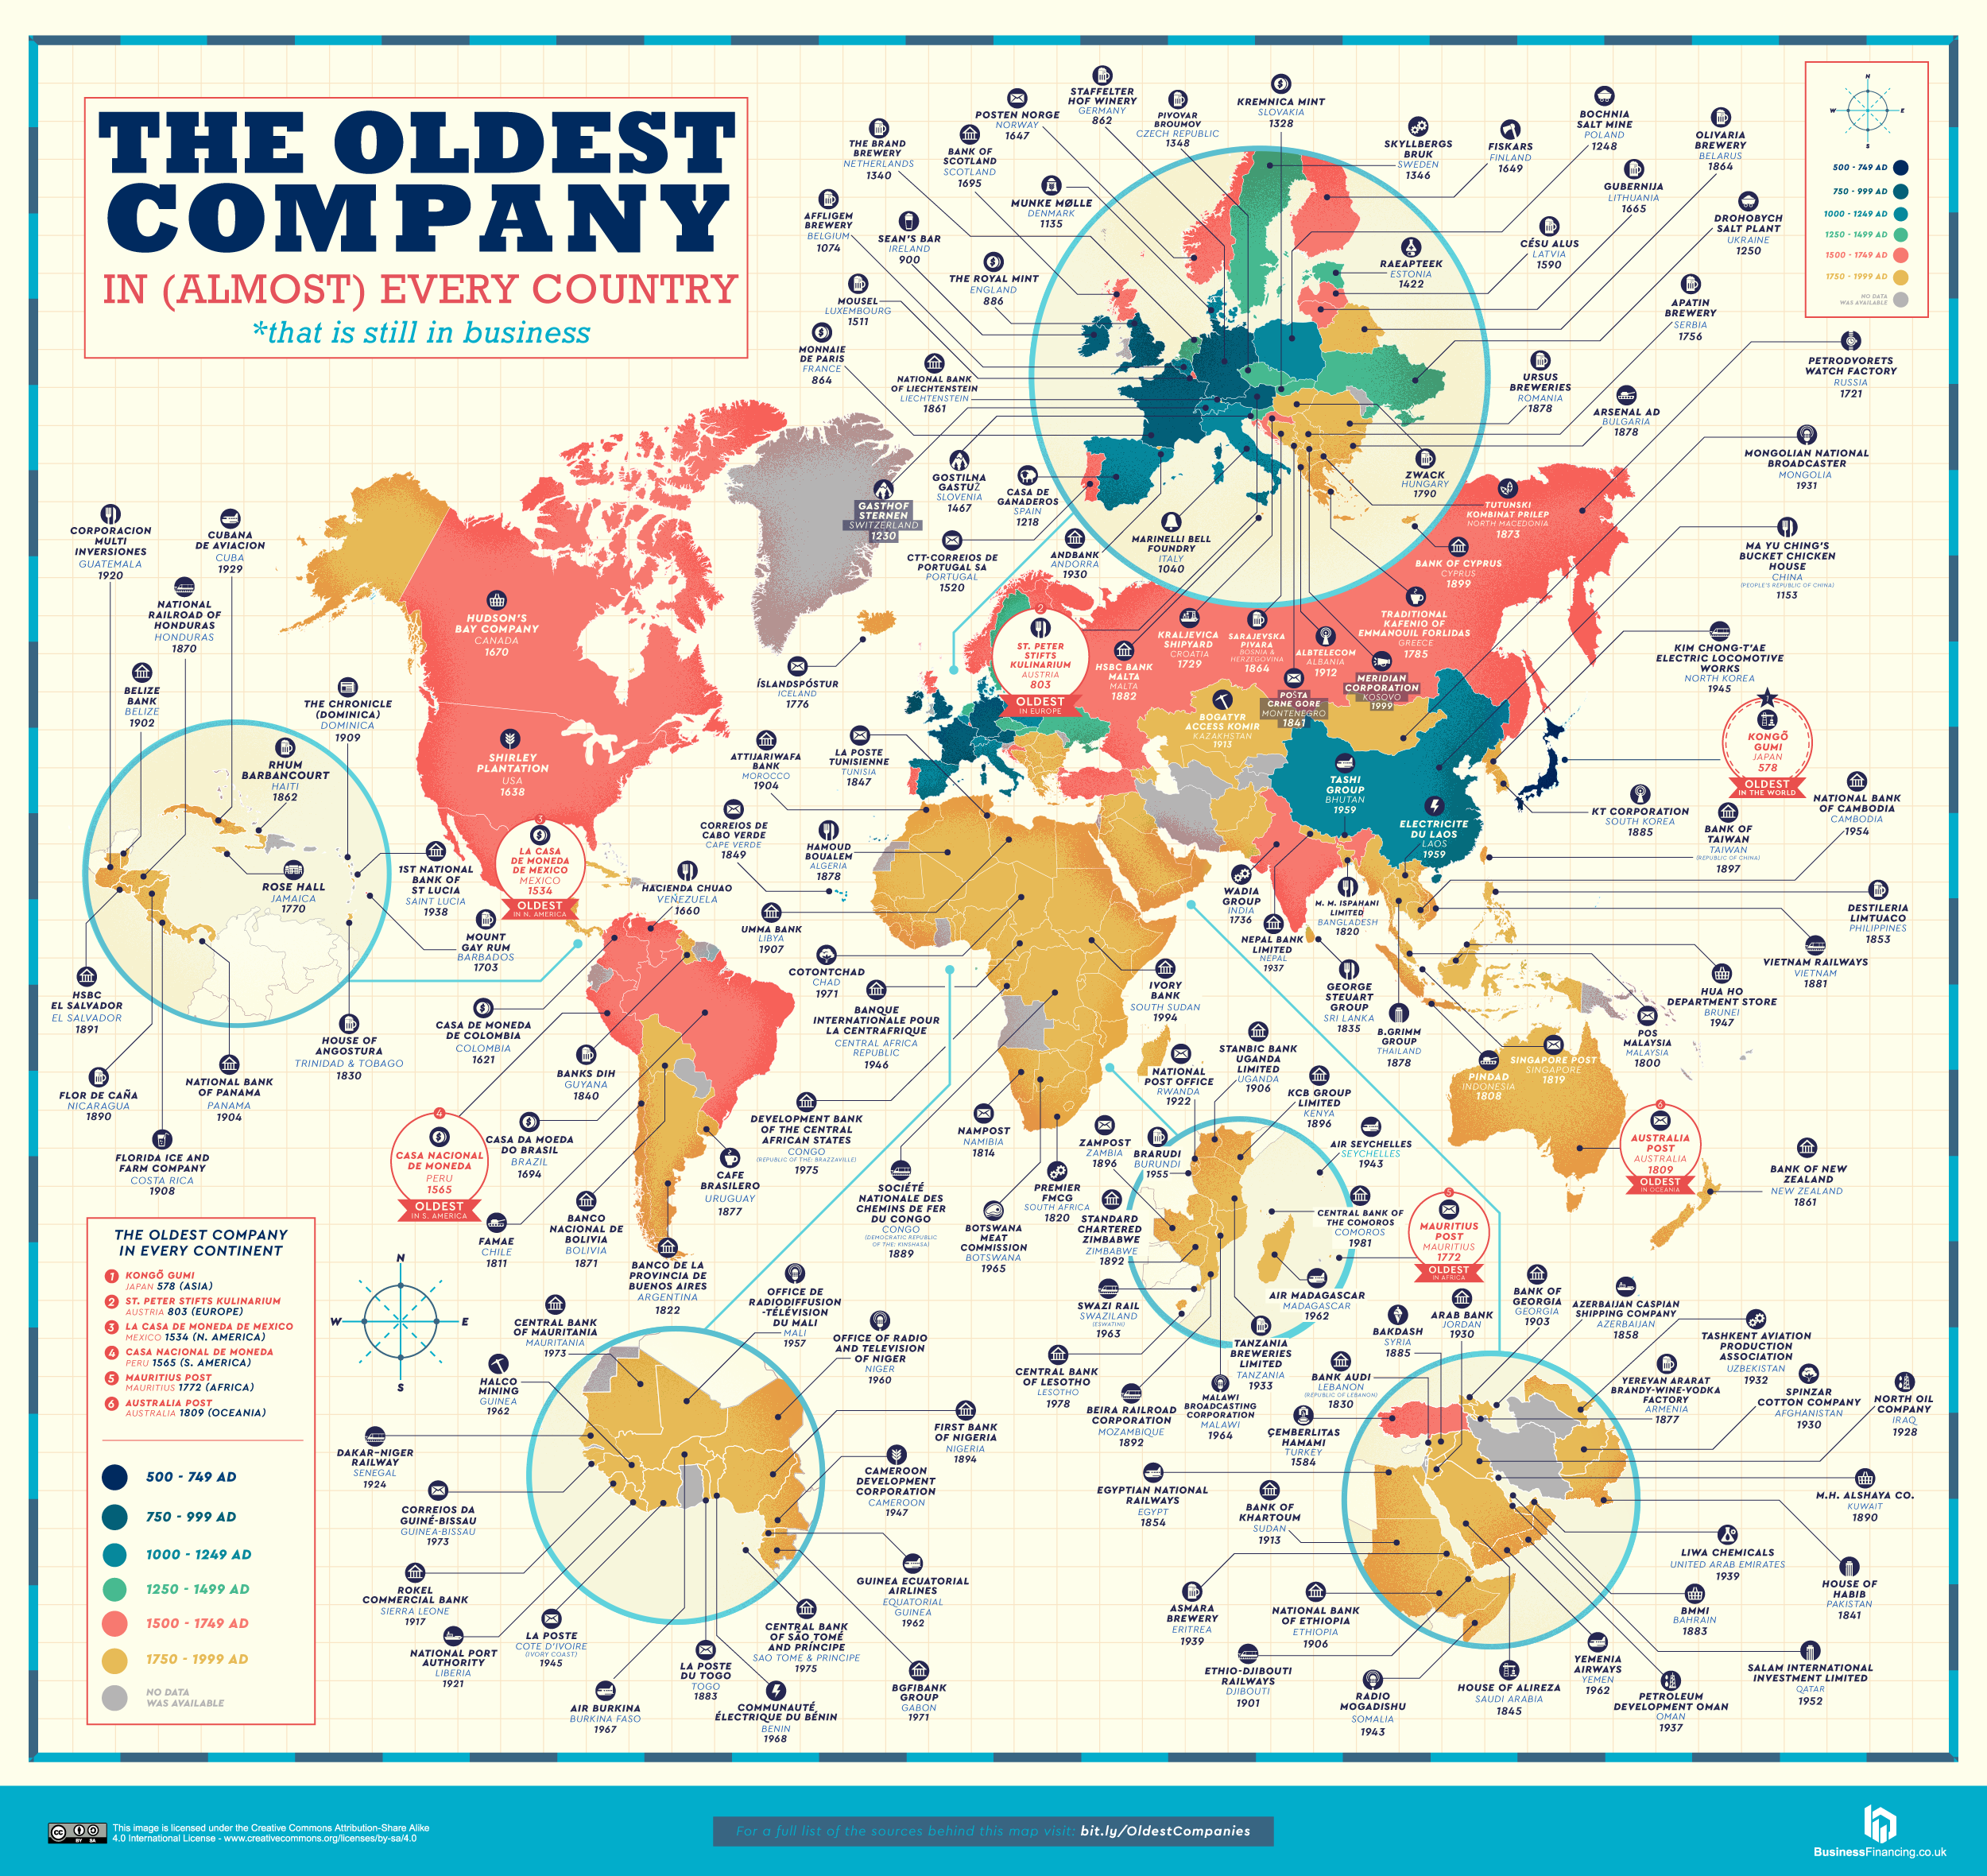
Luckily, many companies around the world have stood the test of time, and today’s detailed map from Business Financing highlights the oldest company in existence in each country.
For centuries, here are the world’s oldest corporations which have made their mark:
| Year | Company Name | Country | Industry |
|---|---|---|---|
| 578 | Kongō Gumi Co., Ltd. | Japan | Construction |
| 803 | St. Peter Stifts Kulinarium | Austria | Service Industry (Restaurant) |
| 862 | Staffelter Hof | Germany | Distillers, Vintners, & Breweries (Winery) |
| 864 | Monnaie de Paris | France | Manufacturing & Production (Mint) |
| 886 | The Royal Mint | England | Manufacturing & Production (Mint) |
| 900 | Sean’s Bar | Ireland | Service Industry (Pub) |
| 1040 | Pontificia Fonderia Marinelli | Italy | Manufacturing & Production (Bell foundry) |
| 1074 | Affligem Brewery | Belgium | Distillers, Vintners, & Breweries |
| 1135 | Munke Mølle | Denmark | Manufacturing & Production (Flour Mill) |
| 1153 | Ma Yu Ching’s Bucket Chicken House | China | Service Industry (Restaurant) |
Whether they were born out of necessity to support a rapidly growing population—requiring new infrastructure and more money circulation—or simply to satisfy peoples’ thirst for alcohol or hunger for fried chicken, these companies continue to play a lasting role.
The Oldest Company in Every Country, by Region
Let’s dive into the regional maps, which paint a different picture for each continent.
In the following maps, countries are color-coded based on the major industry that the oldest company falls under:
- Primary: Natural resources
- Secondary: Manufacturing and processing
- Tertiary: Services and distribution
- Quaternary: Knowledge and information
Notes on Methodology:
This research considers both state-run and independent businesses in their definitions. For countries where data was hard to pin down, they have been grayed out.
As well, since many countries have a relatively new inception, present-day names and borders have been used. The map does not factor in older companies that are no longer in operation, or if it was unclear whether they were still open.
Click here to explore the full research methodology.
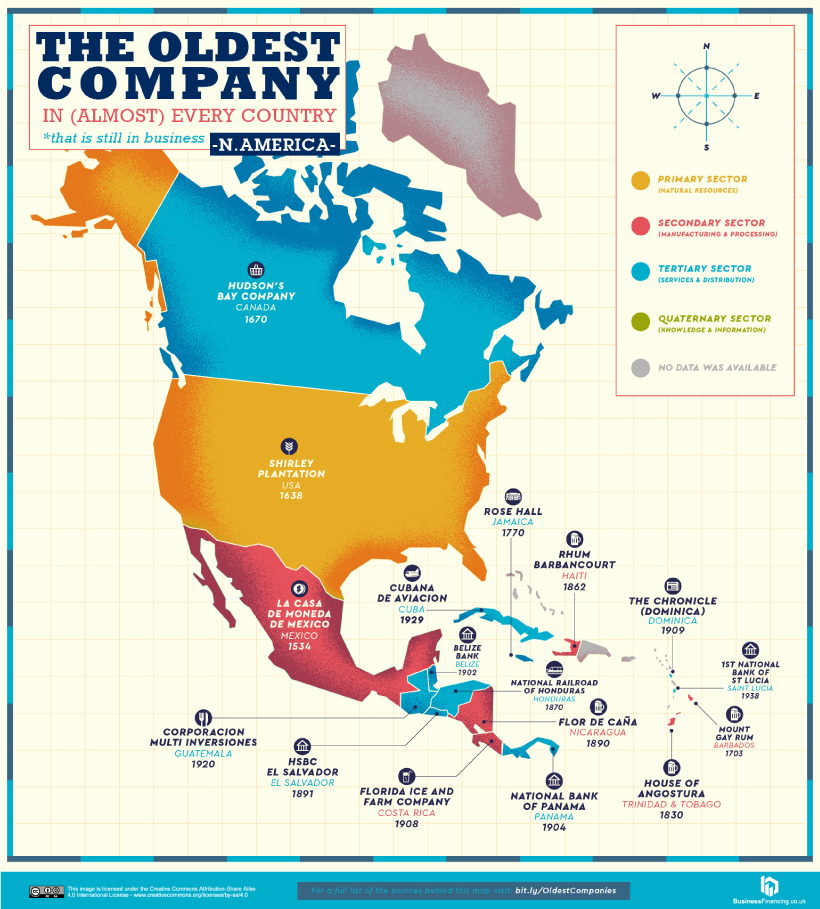
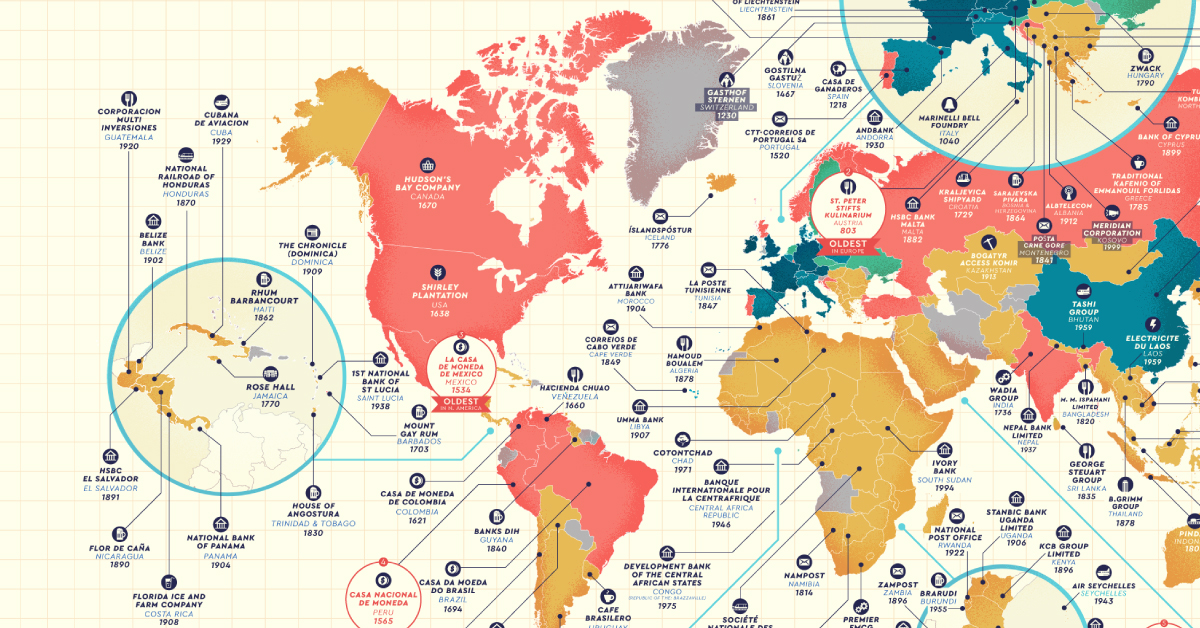
North America
Mexico’s La Casa de Moneda de México (founded 1534) is the oldest company across North America, and the first mint of America. Owned by the Spanish conquistador Hernán Cortés, it was where the famous ‘pieces of eight’, or Spanish dollars were created.
In the U.S., the Shirley Plantation in Virginia is an ongoing reminder of the history of slavery. First founded in 1613, business actually began in 1638—and as many as 90 slaves were under indentured labor on the estate growing tobacco.
Further north, Canada’s Hudson’s Bay (founded 1670) was at the helm of the fur trade between European settlers and First Nations tribes—the two parties agreed on beaver pelts as a common, valuable trade standard.
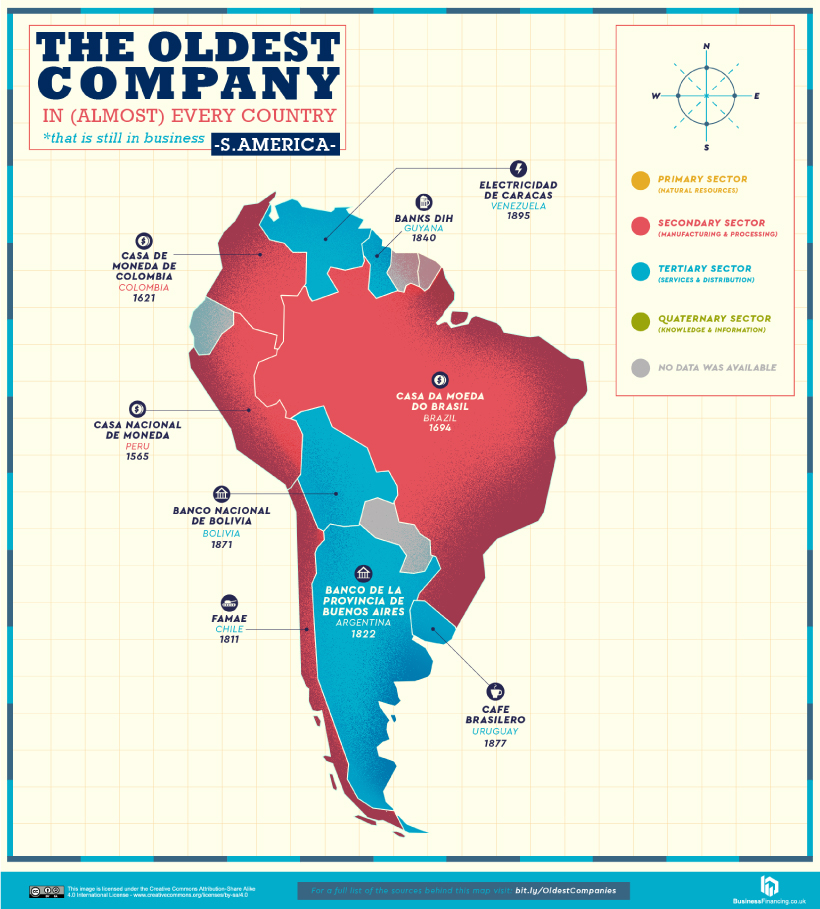
South America
Three of the five oldest companies in South America are mints—specifically in Brazil, Colombia, and Peru.
The oldest of these mints, Casa Nacional de Moneda in Peru, was built on order from Spain and established in 1565. After the great influx of newly-mined silver from America to Europe, the Spanish crown outlined to King Felipe II that building a mint would give the colony economic benefits and more control.
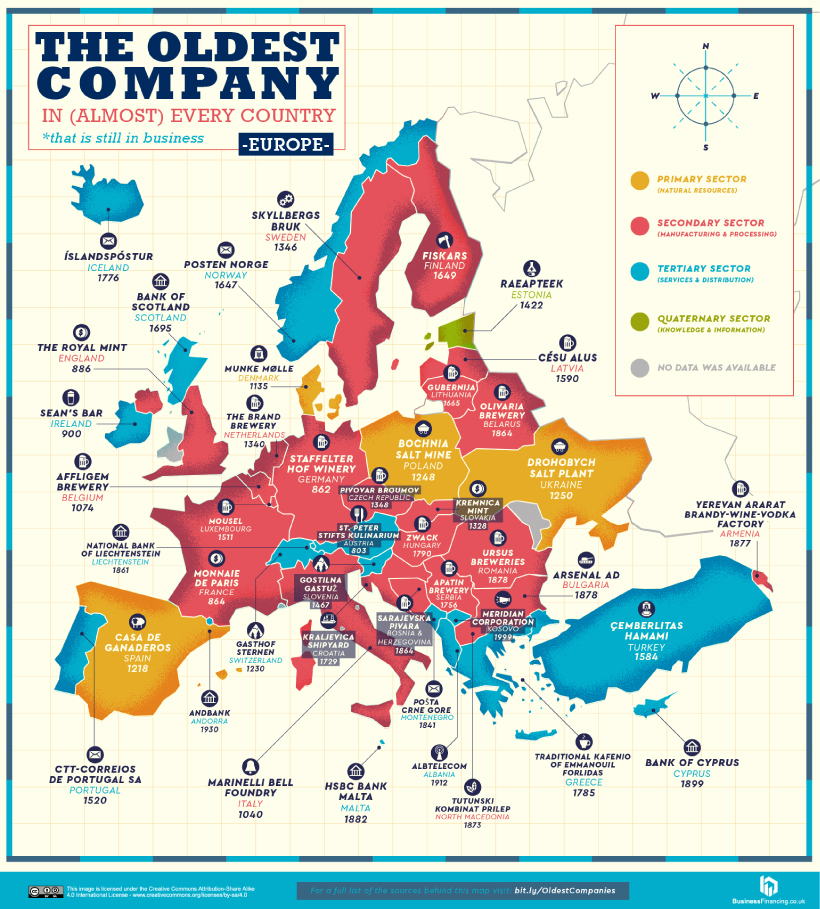
Europe
In total, 15 of Europe’s oldest companies are related to the food and beverage industries, from distilleries, vintners (winemaking), and breweries alongside restaurants and pubs. Austria’s St. Peter Stifts Kulinarium (founded in 803) is Europe’s oldest restaurant, located inside the St. Peter’s Abbey monastery.
Although Germany is famously known for its beer culture, its oldest company is in fact the Staffelter Hof Winery (founded in 862). Today, Germany is still a top wine country, with the industry generating up to $17 billion in revenue per year.
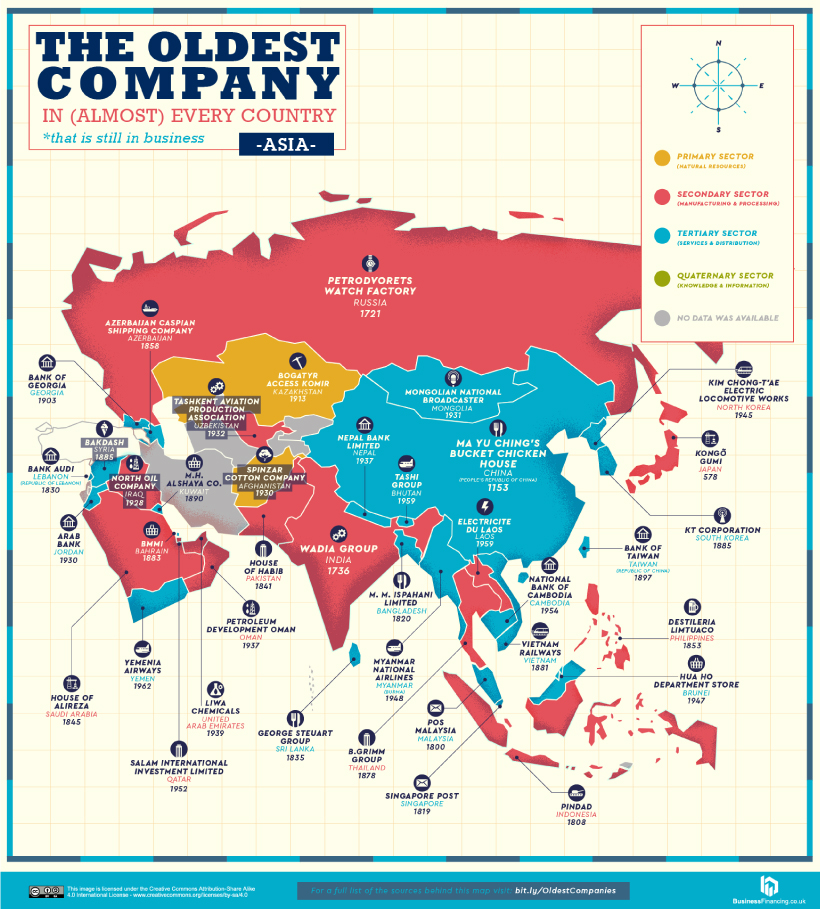
Asia
Asia has six oldest companies in the banking and finance category, as well as another six in the aviation and transport sector. The continent is also home to two of the world’s oldest companies, located in Japan and China.
The Japanese temple and shrine construction company, Kongō Gumi Co., Ltd. (founded in 578) has weathered a few storms over the millennia, from nuclear bombs to financial crises. In 2006, it was bought by the construction conglomerate, Takamatsu Construction Group Co., and continues to operate today.
In neighboring China, Ma Yu Ching’s Bucket Chicken House has endured dynasties of change as well. The company’s simple premise has come a long way, and it was named a cultural heritage in the country’s Henan Province.
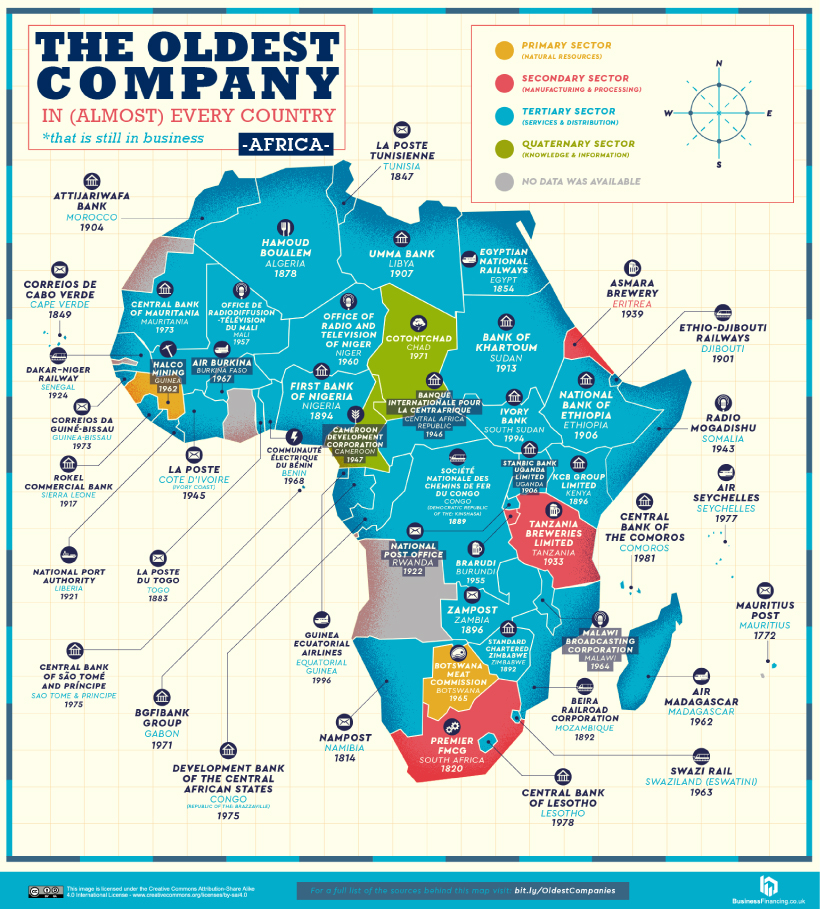
Africa
Africa’s oldest companies are another vestige of the colonial legacy, with 11 transport companies—airlines, ports and shipping, and railways—and 9 postal services.
In fact, Cape Verde’s Correios de Cabo Verde (postal service, founded in 1849) and the DRC’s Société nationale des Chemins de fer du Congo (national railway company, founded in 1889) still go by their Portuguese and French names respectively.
Banking is another one of the oldest industries, with 17 companies across Africa. Zimbabwe’s Standard Chartered branch has been around since 1892, a subsidiary of its London-based parent company.
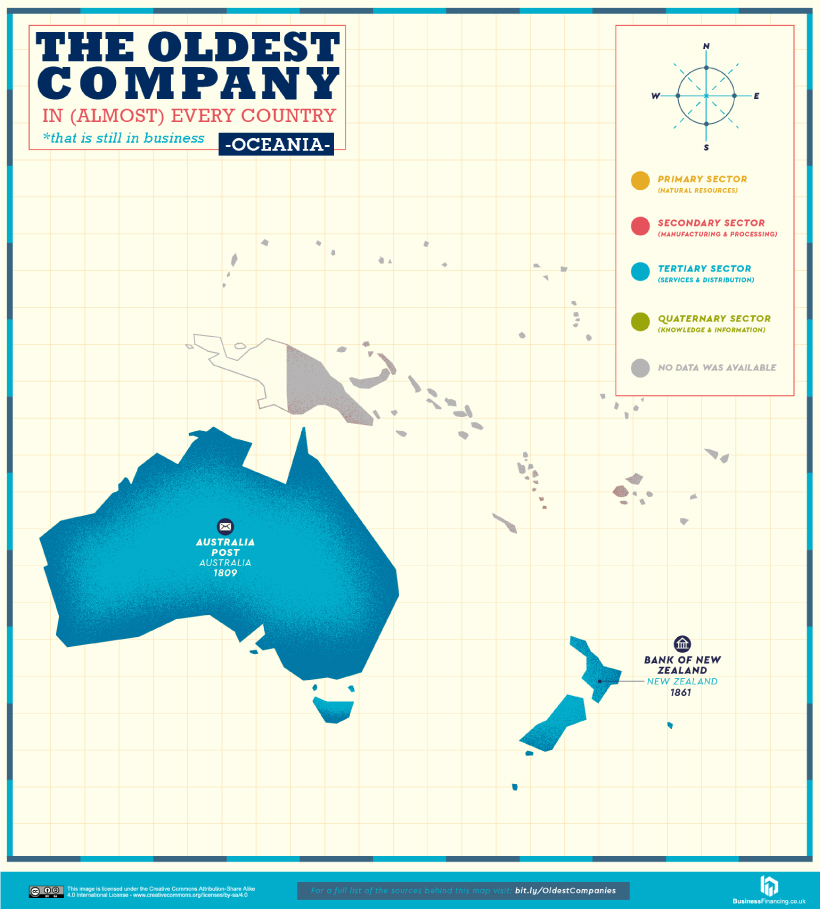
Oceania
Australia officially became a country on January 1st, 1901—but its oldest company, the Australia Post (founded in 1809) precedes this by almost a century.
Interestingly, just one more old company could be located for this region, which is the Bank of New Zealand—one of the country’s Big Four banks.
All in all, these oldest companies paint a historical picture of the major industries which have shaped entire regions.
Did you recognize any on the list?


Politics
The Start of De-Dollarization: China’s Gradual Move Away from the USD
The de-dollarization of China’s trade settlements has begun. What patterns do we see in USD and RMB use within China and globally?
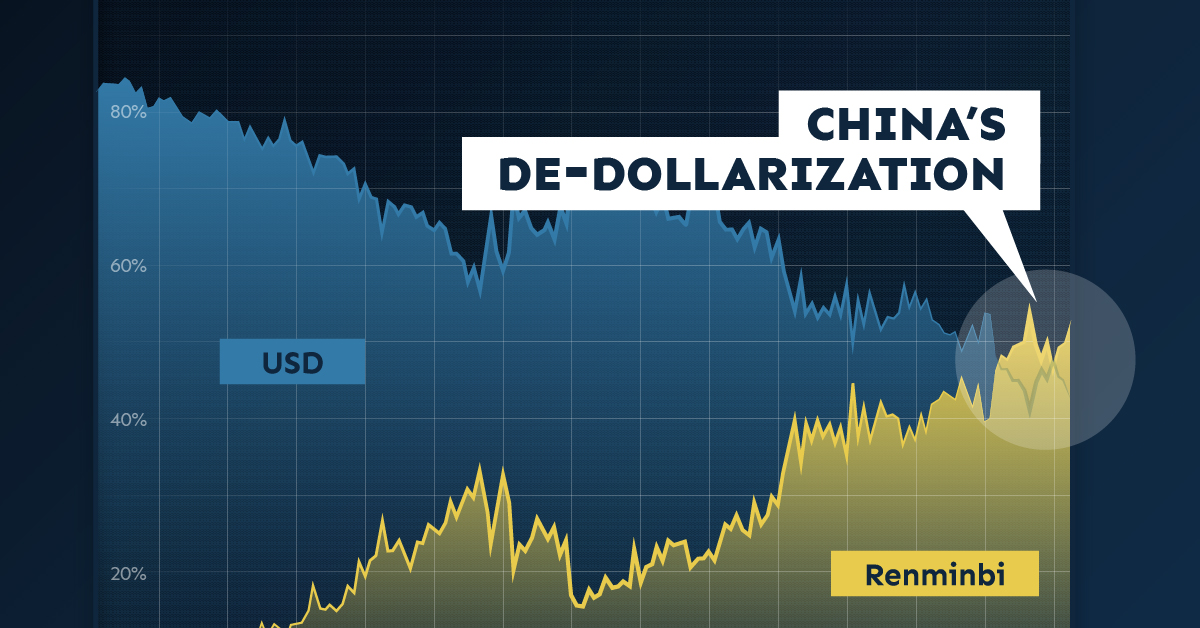


The Start of De-Dollarization: China’s Move Away from the USD
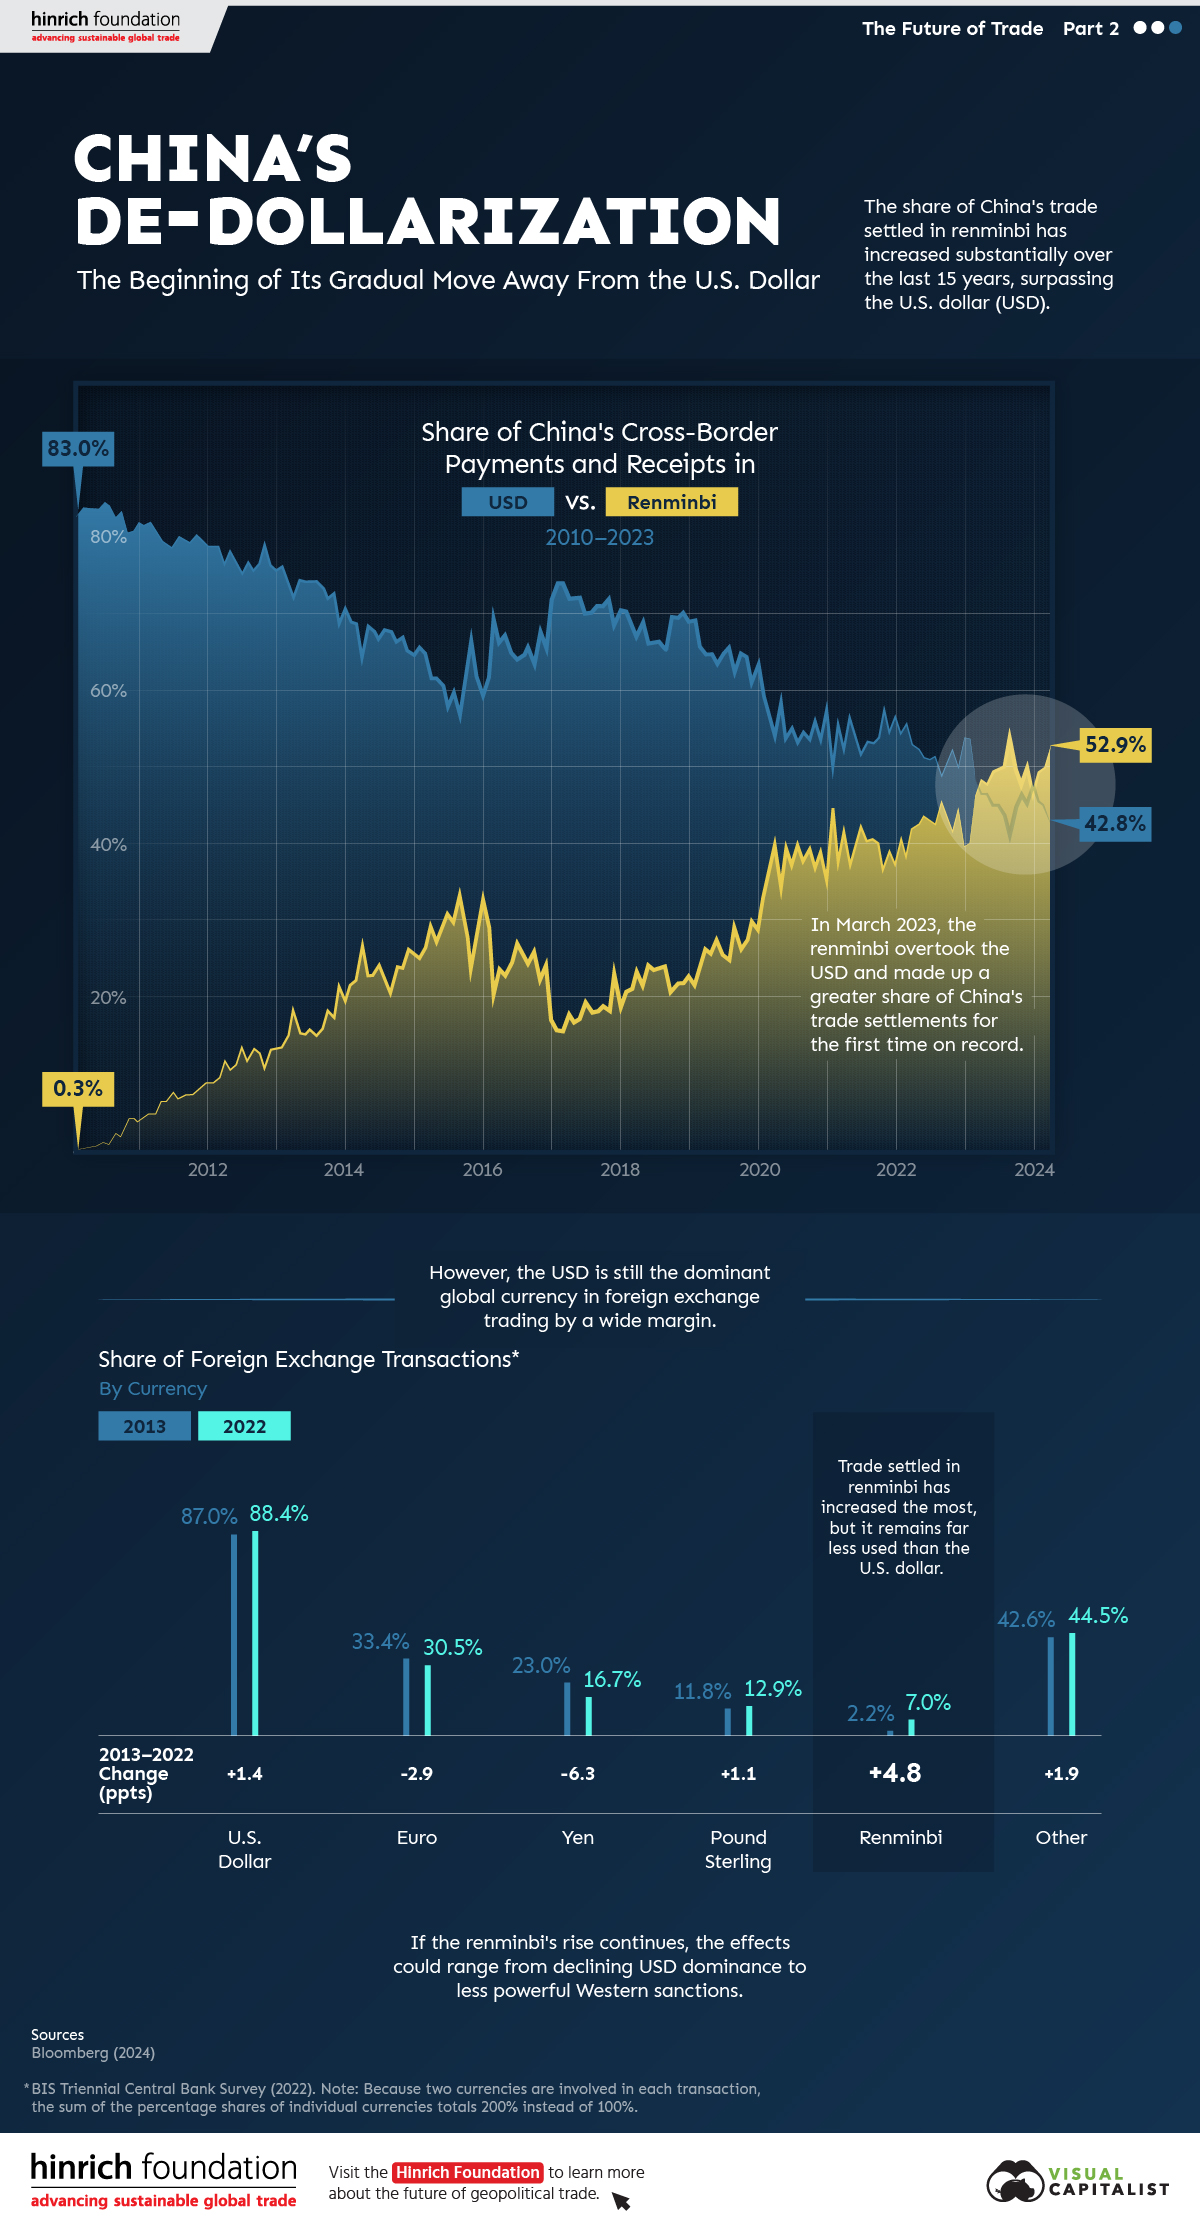
Since 2010, the majority of China’s cross-border payments, like those of many countries, have been settled in U.S. dollars (USD). As of the first quarter of 2023, that’s no longer the case.
This graphic from the Hinrich Foundation, the second in a three-part series covering the future of trade, provides visual context to the growing use of the Chinese renminbi (RMB) in payments both domestically and globally.
The De-Dollarization of China’s Cross-Border Transactions
This analysis uses Bloomberg data on the share of China’s payments and receipts in RMB, USD, and other currencies from 2010 to 2024.
In the first few months of 2010, settlements in local currency accounted for less than 1.0% of China’s cross-border payments, compared to approximately 83.0% in USD.
China has since closed that gap. In March 2023, the share of the RMB in China’s settlements surpassed the USD for the first time.
| Date | Renminbi | U.S. Dollar | Other |
|---|---|---|---|
| March 2010 | 0.3% | 84.3% | 15.4% |
| March 2011 | 4.8% | 81.3% | 13.9% |
| March 2012 | 11.5% | 77.1% | 11.5% |
| March 2013 | 18.1% | 72.7% | 9.2% |
| March 2014 | 26.6% | 64.8% | 8.6% |
| March 2015 | 29.0% | 61.9% | 9.0% |
| March 2016 | 23.6% | 66.7% | 9.7% |
| March 2017 | 17.6% | 72.5% | 9.9% |
| March 2018 | 23.2% | 67.4% | 9.4% |
| March 2019 | 26.2% | 65.1% | 8.7% |
| March 2020 | 39.3% | 54.4% | 6.3% |
| March 2021 | 41.7% | 52.6% | 5.6% |
| March 2022 | 42.1% | 53.3% | 4.7% |
| March 2023 | 48.4% | 46.7% | 4.9% |
| March 2024 | 52.9% | 42.8% | 4.3% |
Source: Bloomberg (2024)
Since then, the de-dollarization in Chinese international settlements has continued.
As of March 2024, over half (52.9%) of Chinese payments were settled in RMB while 42.8% were settled in USD. This is double the share from five years previous. According to Goldman Sachs, foreigners’ increased willingness to trade assets denominated in RMB significantly contributed to de-dollarization in favor of China’s currency. Also, early last year, Brazil and Argentina announced that they would begin allowing trade settlements in RMB.
Most Popular Currencies in Foreign Exchange (FX) Transactions
Globally, analysis from the Bank for International Settlements reveals that, in 2022, the USD remained the most-used currency for FX settlements. The euro and the Japanese yen came in second and third, respectively.
| Currency | 2013 | 2022 | Change (pp) |
|---|---|---|---|
| U.S. Dollar | 87.0% | 88.5% | +1.5 |
| Euro | 33.4% | 30.5% | -2.9 |
| Yen | 23.0% | 16.7% | -6.3 |
| Pound Sterling | 11.8% | 12.9% | +1.1 |
| Renminbi | 2.2% | 7.0% | +4.8 |
| Other | 42.6% | 44.4% | +1.8 |
| Total | 200.0% | 200.0% |
Source: BIS Triennial Central Bank Survey (2022). Because two currencies are involved in each transaction, the sum of the percentage shares of individual currencies totals 200% instead of 100%.
The Chinese renminbi, though accounting for a relatively small share of FX transactions, gained the most ground over the last decade. Meanwhile, the euro and the yen saw decreases in use.
The Future of De-Dollarization
If the RMB’s global rise continues, the stranglehold of the USD on international trade could diminish over time.
The impacts of declining dollar dominance are complex and uncertain, but they could range from the underperformance of U.S. financial assets to diminished power of Western sanctions.
However, though the prevalence of RMB in international payments could rise, a complete de-dollarization of the world economy in the near- or medium-term is unlikely. China’s strict capital controls that limit the availability of RMB outside the country, and the nation’s sputtering economic growth, are key reasons contributing to this.
The third piece in this series will explore Russia’s shifting trading patterns following its invasion of Ukraine.
Visit the Hinrich Foundation to learn more about the future of geopolitical trade

-
 War1 day ago
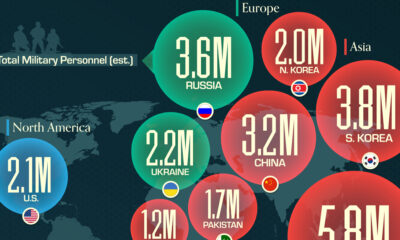
Mapped: The World’s Largest Armies in 2024
Vietnam, India, and South Korea top the list.
-

 China2 weeks ago
Which Countries Have the Most Economic Influence in Southeast Asia?
One country dominates this survey of who has the most economic influence in the region.
-

 Public Opinion3 weeks ago
Charted: How Democrats and Republicans View Government Agencies
Predictably, results diverge when both Democrats and Republicans are asked to rate key government agencies in the United States.
-

 War3 weeks ago
Visualized: Aircraft Carriers by Country
The U.S. controls 40% of global aircraft carrier fleet.
-

 Public Opinion3 weeks ago
Charted: How Americans Feel About Federal Government Agencies
Fourteen of 16 federal government agencies garnered more favorable responses than unfavorable ones. But what were the outliers?
-

 Misc4 weeks ago
Charted: What Southeast Asia Thinks About China & the U.S.
A significant share of respondents from an ASEAN-focused survey are not happy about rising American and Chinese influence in the region.


-

 Maps7 days ago
Map: Where Are America’s Largest Landfills?
-

 Markets2 weeks ago
Ranked: The World’s 50 Largest Private Equity Firms
-

 Markets2 weeks ago
Mapped: The 10 U.S. States With the Lowest Real GDP Growth
-

 China2 weeks ago
Comparing New and Current U.S. Tariffs on Chinese Imports
-
China2 weeks ago
Which Countries Have the Most Economic Influence in Southeast Asia?
-

 Misc2 weeks ago
The Top 25 Nationalities of U.S. Immigrants
-

 Demographics2 weeks ago
Ranked: Countries Where Youth are the Most Unhappy, Relative to Older Generations
-

 Technology2 weeks ago
Visualizing the 5 Most Common Cybersecurity Mistakes