Green
The World’s 25 Largest Lakes, Side by Side
The World’s 25 Largest Lakes, Side by Side
In many parts of the world, you don’t have to look very far to find a lake.
According to satellite data, there are roughly 100 million lakes larger than one hectare (2.47 acres) to be found globally. The largest lakes, which rival the size of entire nations, are more of a rarity.
One might expect the world’s largest lakes to be very alike, but from depth to saline content, their properties can be quite different. As well, the ranking of the world’s largest lakes is far from static, as human activity can turn a massive body of water into a desert within a single generation.
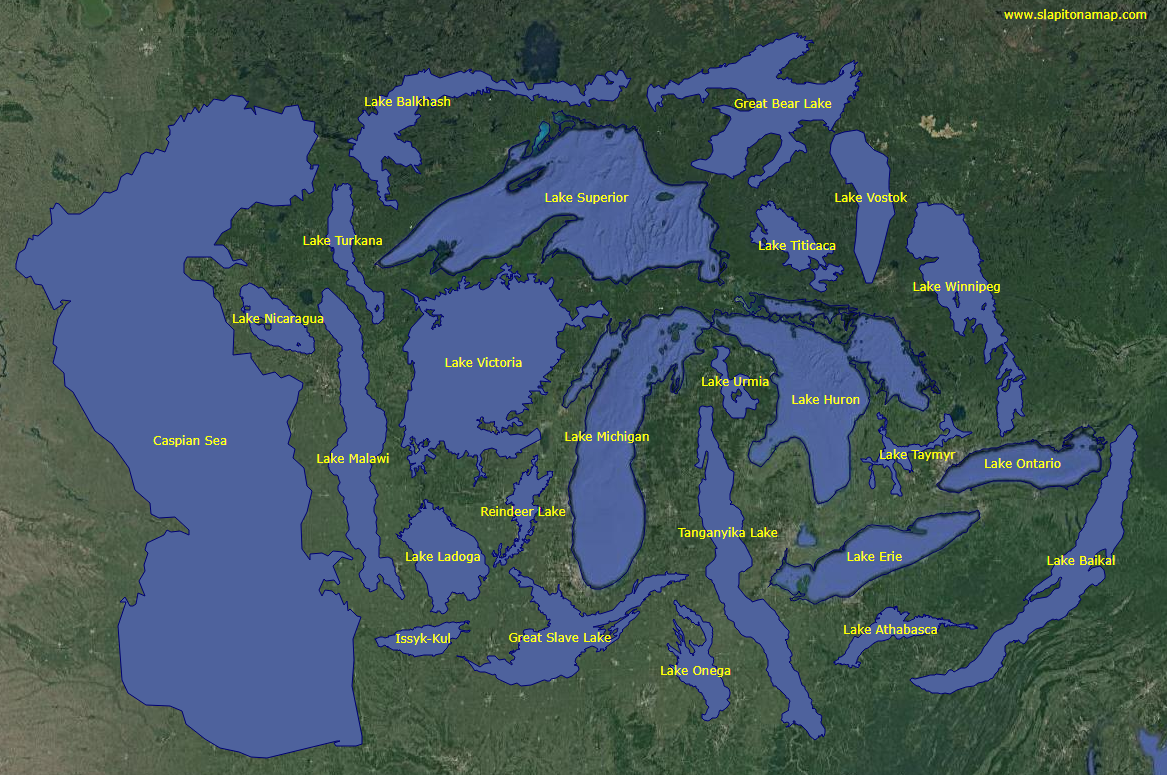
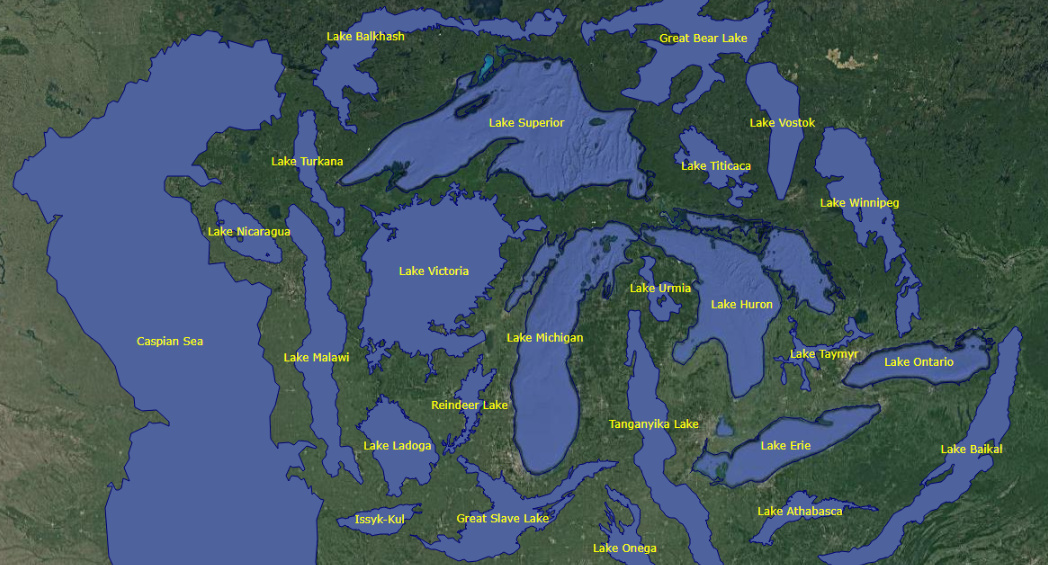
Today’s graphic – created using the fantastic online tool, Slap It On A Map! – uses the Great Lakes region as a point of comparison for the largest 25 lakes, by area. This is particularly useful in comparing the scale of lakes that are located in disparate parts of the globe.
The Greatest Lakes
The largest lake in the world by a long shot is the Caspian Sea – a name that hints at a past when it was contiguous with the ocean around 11 million years ago. This massive saline lake, which is nearly the same size as Japan, borders five countries: Kazakhstan, Russia, Turkmenistan, Azerbaijan, and Iran. An estimated 48 billion barrels of oil lay beneath the surface of the basin.
The five Great Lakes, which run along the Canada–U.S. border, form one of the largest collections of fresh water on Earth. This interconnected series of lakes represents around 20% of the world’s fresh water and the region supports over 100 million people, roughly equal to one-third of the Canada–U.S. population.
Amazingly, a single lake holds as much fresh water as all the Great Lakes combined – Lake Baikal. This rift lake in Siberia has a maximum depth of 5,371ft (1,637m). For comparison, the largest of the Great Lakes (Lake Superior) is only 25% as deep, with a maximum depth of 1,333ft (406m). Lake Baikal is unique in a number of other ways too. It is the world’s oldest, coldest lake, and around 80% of its animal species are endemic (not found anywhere else).
Here’s a full run-down of the top 25 lakes by area:
| Rank | Lake Name | Surface Area | Type | Countries on shoreline |
|---|---|---|---|---|
| 1 | Caspian Sea | 143,000 sq mi (371,000km²) | Saline | 🇰🇿 Kazakhstan 🇷🇺 Russia 🇹🇲 Turkmenistan 🇦🇿 Azerbaijan 🇮🇷 Iran |
| 2 | Superior | 31,700 sq mi (82,100km²) | Freshwater | 🇨🇦 Canada 🇺🇸 U.S. |
| 3 | Victoria | 26,590 sq mi (68,870km²) | Freshwater | 🇺🇬 Uganda 🇰🇪 Kenya 🇹🇿 Tanzania |
| 4 | Huron | 23,000 sq mi (59,600km²) | Freshwater | 🇨🇦 Canada 🇺🇸 U.S. |
| 5 | Michigan | 22,000 sq mi (58,000km²) | Freshwater | 🇺🇸 U.S. |
| 6 | Tanganyika | 12,600 sq mi (32,600km²) | Freshwater | 🇧🇮 Burundi 🇹🇿 Tanzania 🇿🇲 Zambia 🇨🇩 D.R.C. |
| 7 | Baikal | 12,200 sq mi (31,500km²) | Freshwater | 🇷🇺 Russia |
| 8 | Great Bear Lake | 12,000 sq mi (31,000km²) | Freshwater | 🇨🇦 Canada |
| 9 | Malawi | 11,400 sq mi (29,500km²) | Freshwater | 🇲🇼 Malawi 🇲🇿 Mozambique 🇹🇿 Tanzania |
| 10 | Great Slave Lake | 10,000 sq mi (27,000km²) | Freshwater | 🇨🇦 Canada |
| 11 | Erie | 9,900 sq mi (25,700km²) | Freshwater | 🇨🇦 Canada 🇺🇸 U.S. |
| 12 | Winnipeg | 9,465 sq mi (24,514km²) | Freshwater | 🇨🇦 Canada |
| 13 | Ontario | 7,320 sq mi (18,960km²) | Freshwater | 🇨🇦 Canada 🇺🇸 U.S. |
| 14 | Ladoga | 7,000 sq mi (18,130km²) | Freshwater | 🇷🇺 Russia |
| 15 | Balkhash | 6,300 sq mi (16,400km²) | Saline | 🇰🇿 Kazakhstan |
| 16 | Vostok | 4,800 sq mi (12,500km²) | Freshwater | 🇦🇶 Antarctica |
| 17 | Onega | 3,700 sq mi (9,700km²) | Freshwater | 🇷🇺 Russia |
| 18 | Titicaca | 3,232 sq mi (8,372km²) | Freshwater | 🇧🇴 Bolivia 🇵🇪 Peru |
| 19 | Nicaragua | 3,191 sq mi (8,264km²) | Freshwater | 🇳🇮 Nicaragua |
| 20 | Athabasca | 3,030 sq mi (7,850km²) | Freshwater | 🇨🇦 Canada |
| 21 | Taymyr | 2,700 sq mi (6,990km²) | Freshwater | 🇷🇺 Russia |
| 22 | Turkana | 2,473 sq mi (6,405km²) | Saline | 🇰🇪 Kenya 🇪🇹 Ethiopia |
| 23 | Reindeer Lake | 2,440 sq mi (6,330km²) | Freshwater | 🇨🇦 Canada |
| 24 | Issyk-Kul | 2,400 sq mi (6,200km²) | Saline | 🇰🇬 Kyrgyzstan |
| 25 | Urmia | 2,317 sq mi (6,001km²) | Saline | 🇮🇷 Iran |
The Great Lakes World Tour
For people living in Canada and the U.S., the shape and relative size of the Great Lakes system may be quite familiar. This makes the Great Lakes a fantastic point of comparison to help put the size of other world locations into perspective. To this end, we begin our Great Lakes World Tour.
First, the image below shows how the Great Lakes system would look if it was located in India.
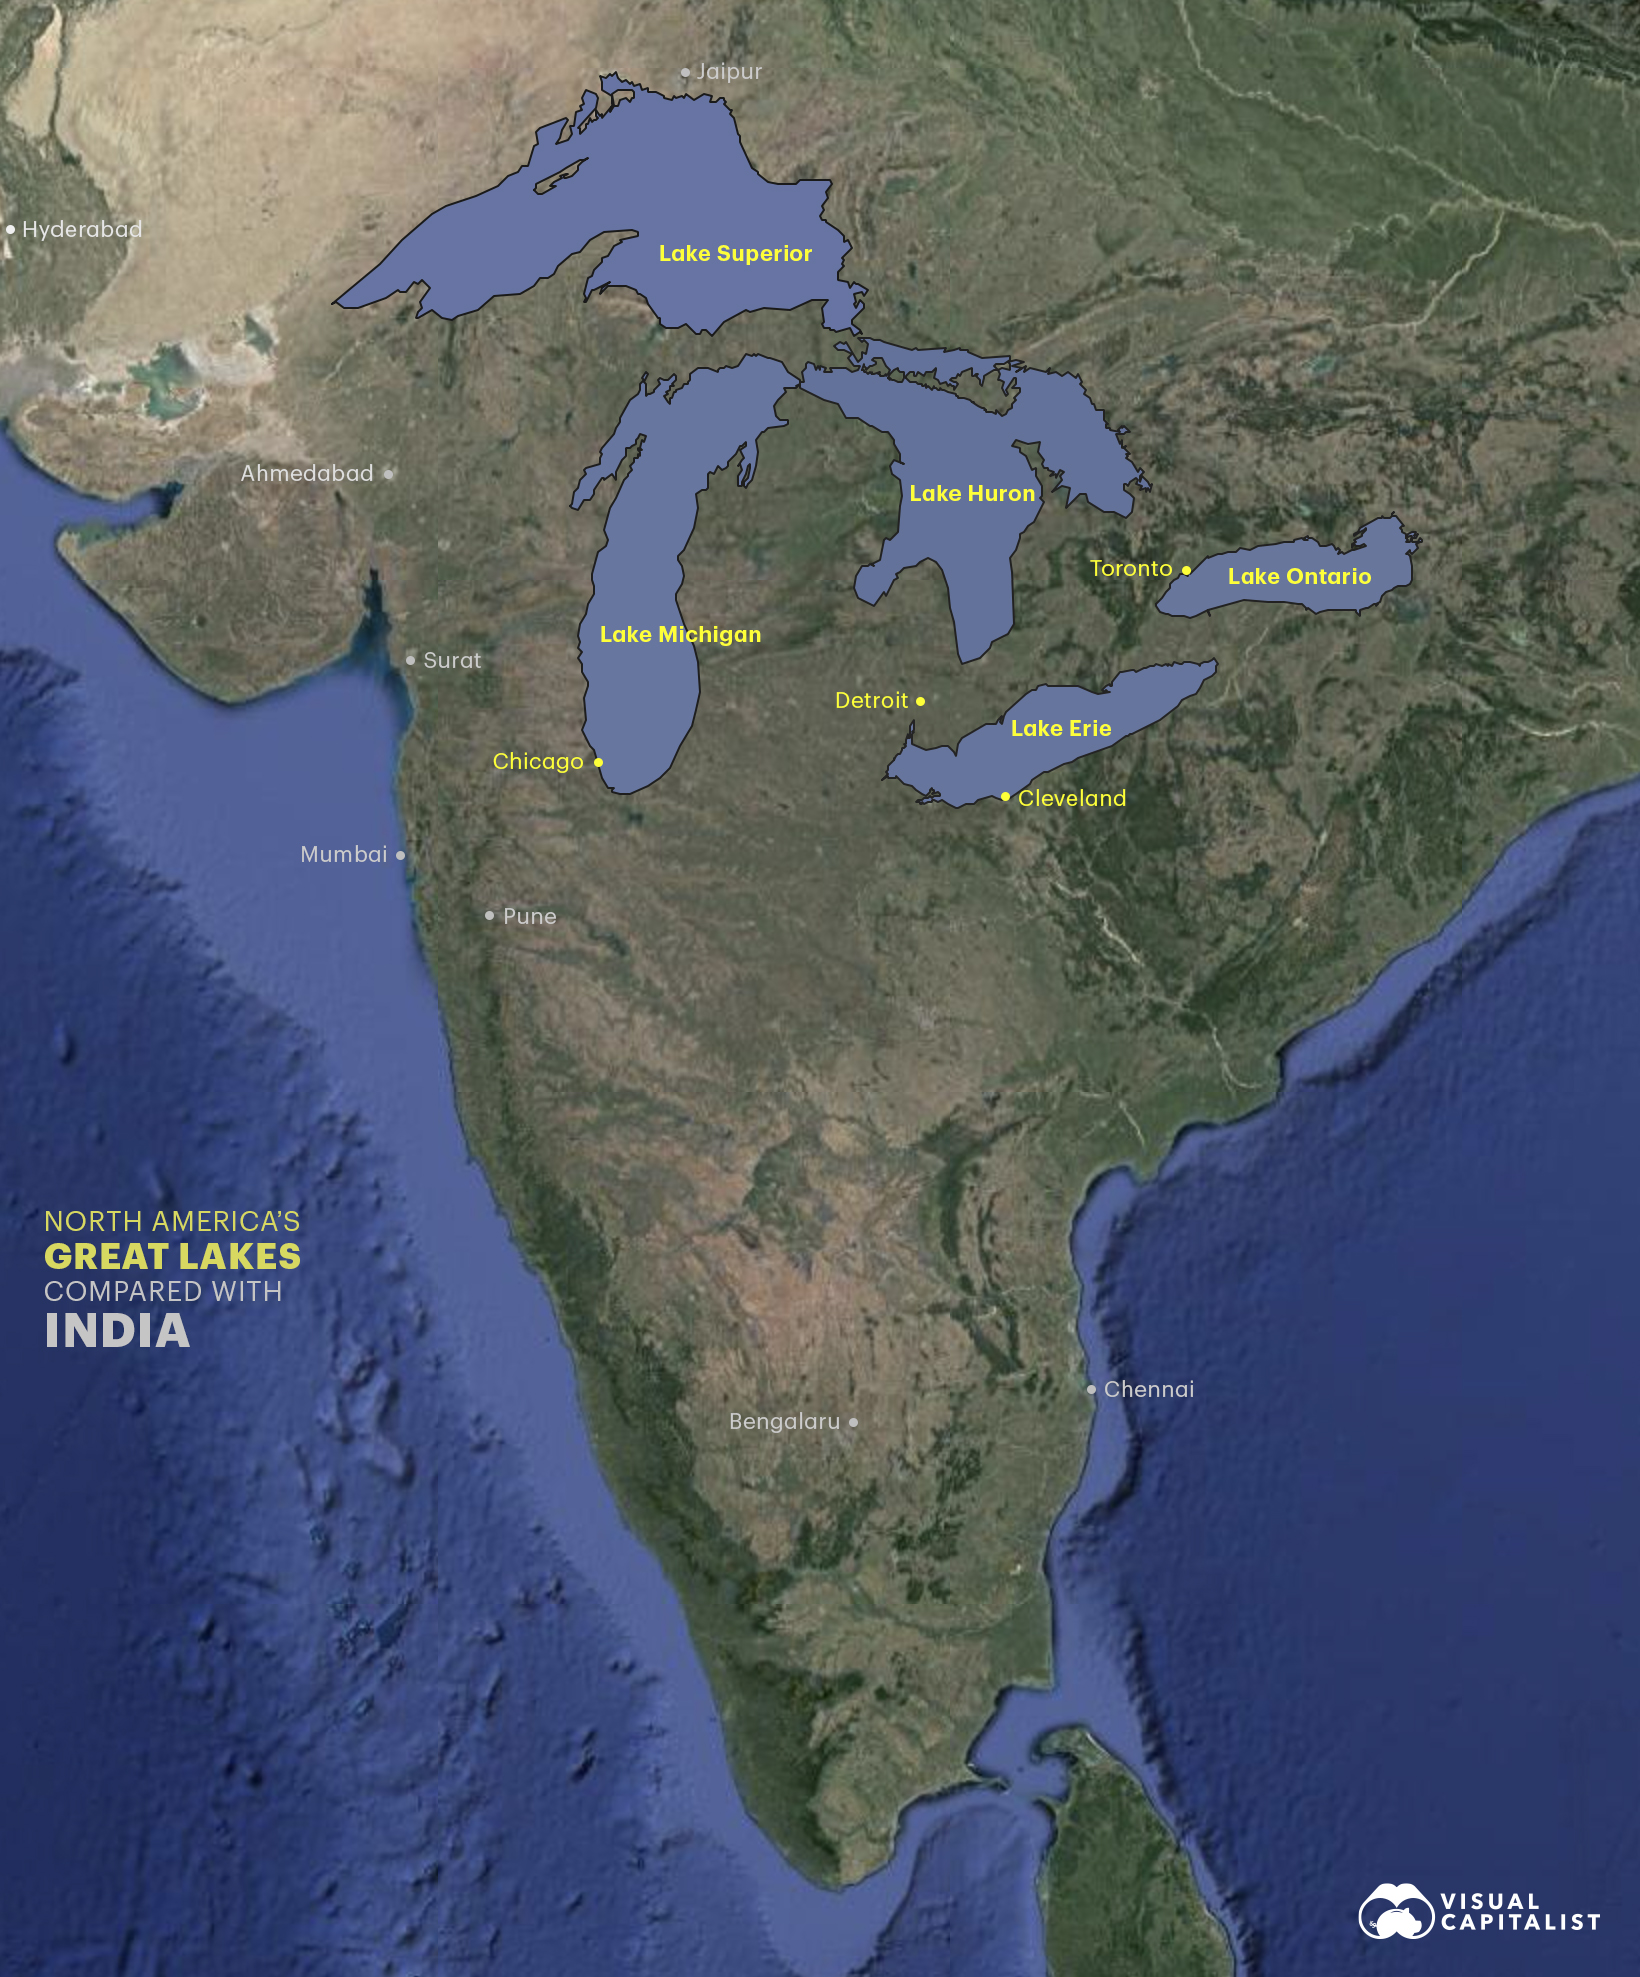
Distortions on commonly used maps can downplay the size of India compared to more northern nations. This view of the Great Lakes can help put India’s true size into perspective.
Next, we look at the Great Lakes overlaid within Central Europe.
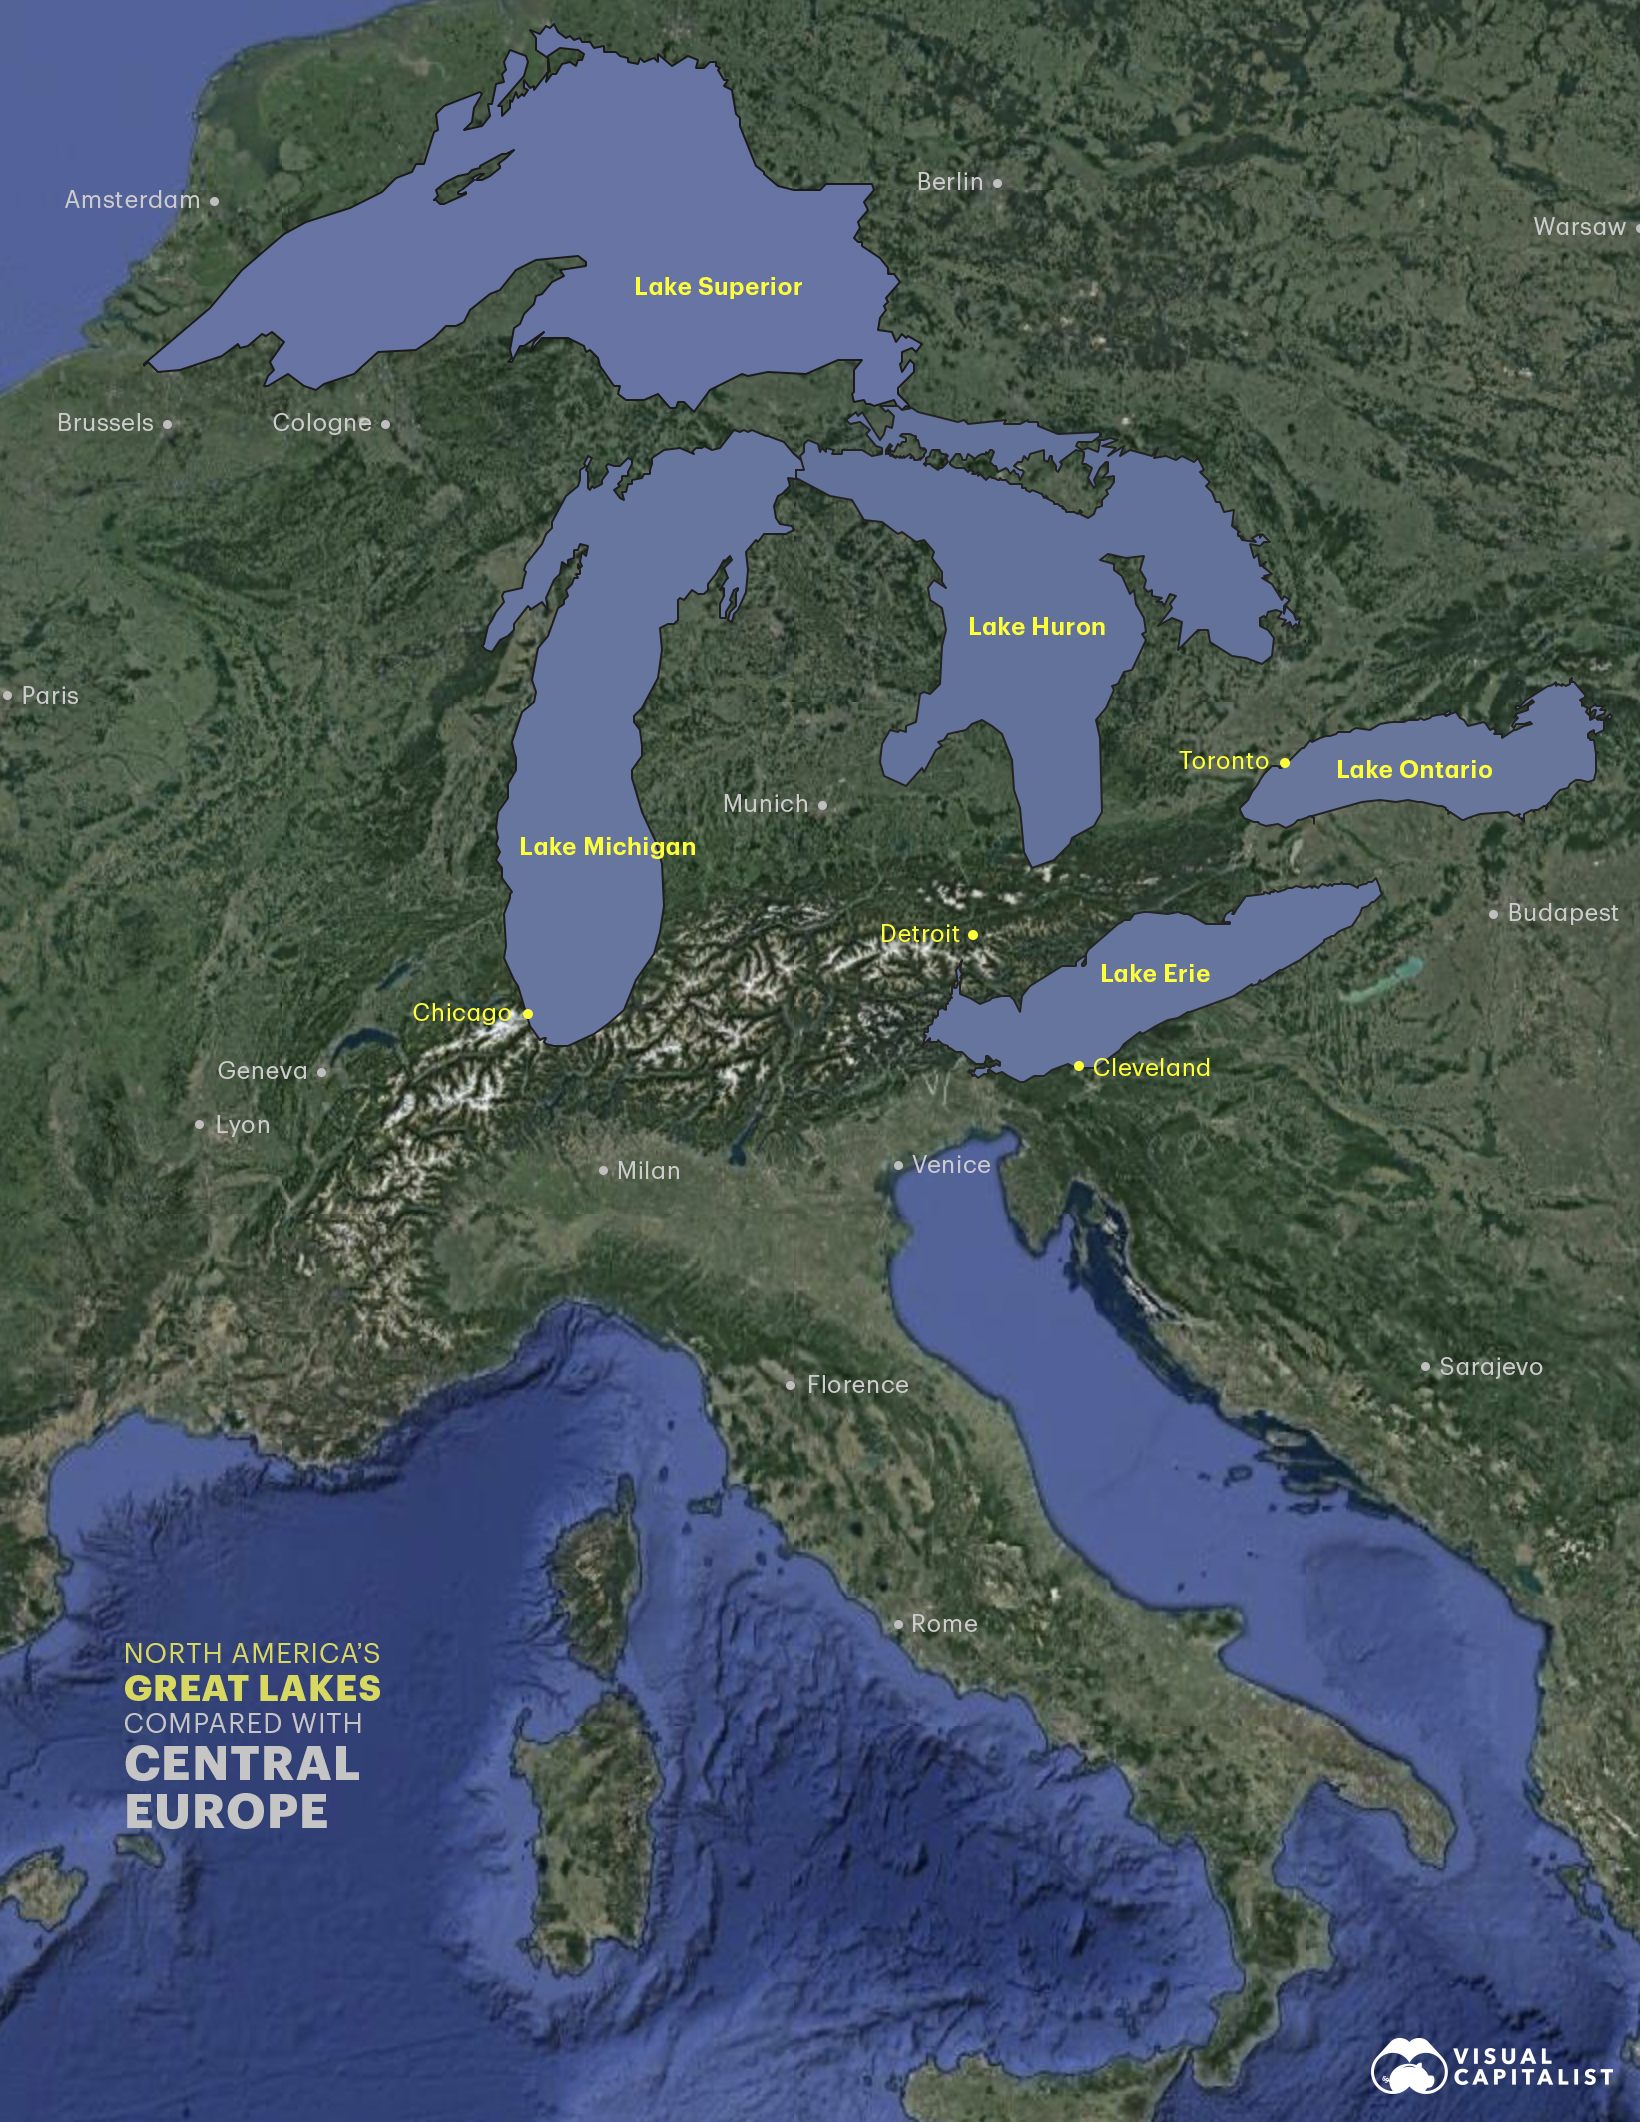
In the context of Europe, the lakes are so large that they extend from the Netherlands over to Slovakia. Lake Superior’s surface area of 31,700 mi2 (82,000 km2), is similar in size to Austria. Here’s are the five Great Lakes and European countries of equivalent size:
| Great Lakes | Surface Area | Equivalent Country | Area |
|---|---|---|---|
| Lake Superior | 82,000 km2 (31,700 sq mi) | 🇦🇹 Austria | 83,879 km2 (32,386 sq mi) |
| Lake Huron | 60,000 km2 (23,000 sq mi) | 🇱🇻 Latvia | 64,589 km2 (24,938 sq mi) |
| Lake Michigan | 58,000 km2 (22,300 sq mi) | 🇭🇷 Croatia | 56,594 km2 (21,851 sq mi) |
| Lake Erie | 25,700 km2 (9,910 sq mi) | 🇲🇰 North Macedonia | 25,713 km2 (9,928 sq mi) |
| Lake Ontario | 19,000 km2 (7,340 sq mi) | 🇸🇮 Slovenia | 20,271 km2 (7,827 sq mi) |
Lastly, here is a look at the Great Lakes in Southern Australia. Australia is the world’s 6th largest country, so the Great Lakes only occupy one corner of its land mass.
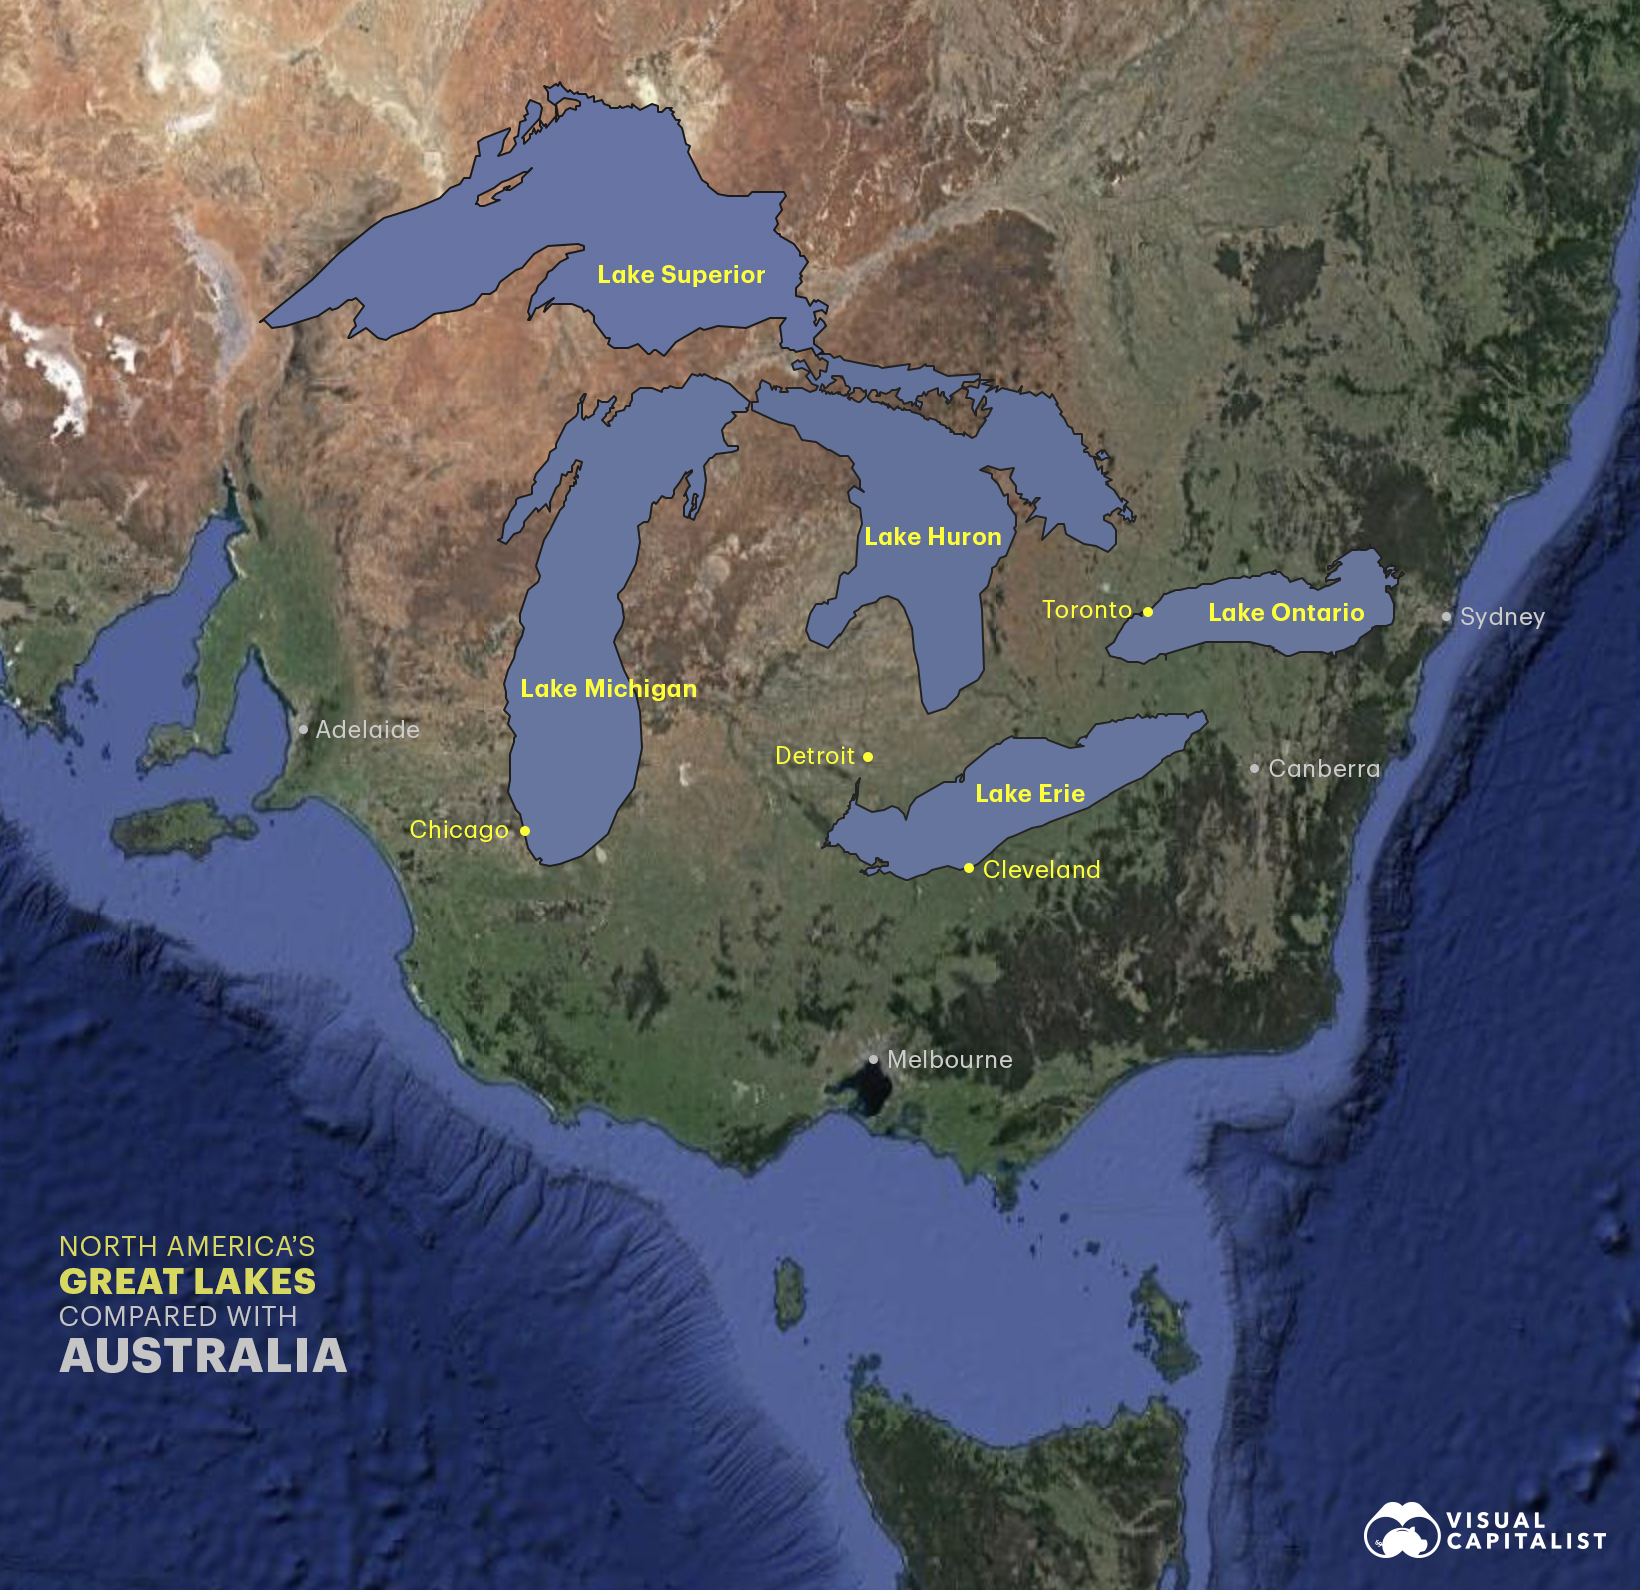
Australia’s lack of glacial history means that there are few permanent freshwater lakes in the country. Many of the country’s largest lakes only fill up during periods of excessive rainfall.
Shrinking out of the rankings
Not far from the world’s largest lake, straddling the border between Kazakhstan and Uzbekistan, lay the sand dunes of the Aralkum Desert. In the not so distant past, this harsh environment was actually the bed of one of the largest lakes in the world – the Aral Sea.
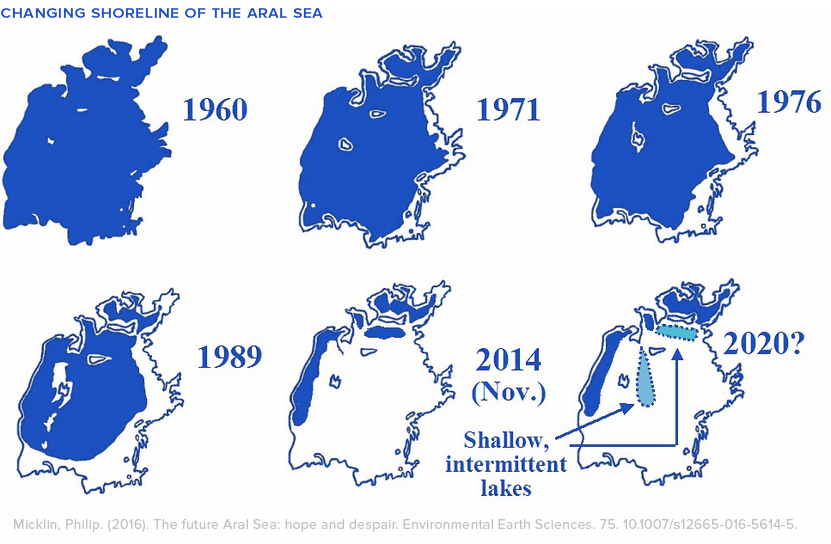
For reasons both climatic and anthropogenic, the Aral Sea began receding in the 1960s. This dramatic change in surface area took the Aral Sea from the fourth largest lake on Earth to not even ranking in the top 50. Researchers note that the size of the lake has fluctuated a lot over history, but through the lens of modern history these recent changes happened rapidly, leaving local economies devastated and former shoreside towns landlocked.
Lake Chad, in Saharan Africa, and Lake Urmia, in Iran, both face similar challenges, shrinking dramatically in recent decades.
How we work to reverse damage and avoid ecosystem collapse in vulnerable lakes will have a big influence on how the top 25 list may look in future years.


Environment
The Rise in America’s Billion-Dollar Extreme Weather Disasters
From tropical cyclones to severe storms, the number of extreme weather disasters with losses exceeding $1 billion has climbed over time.
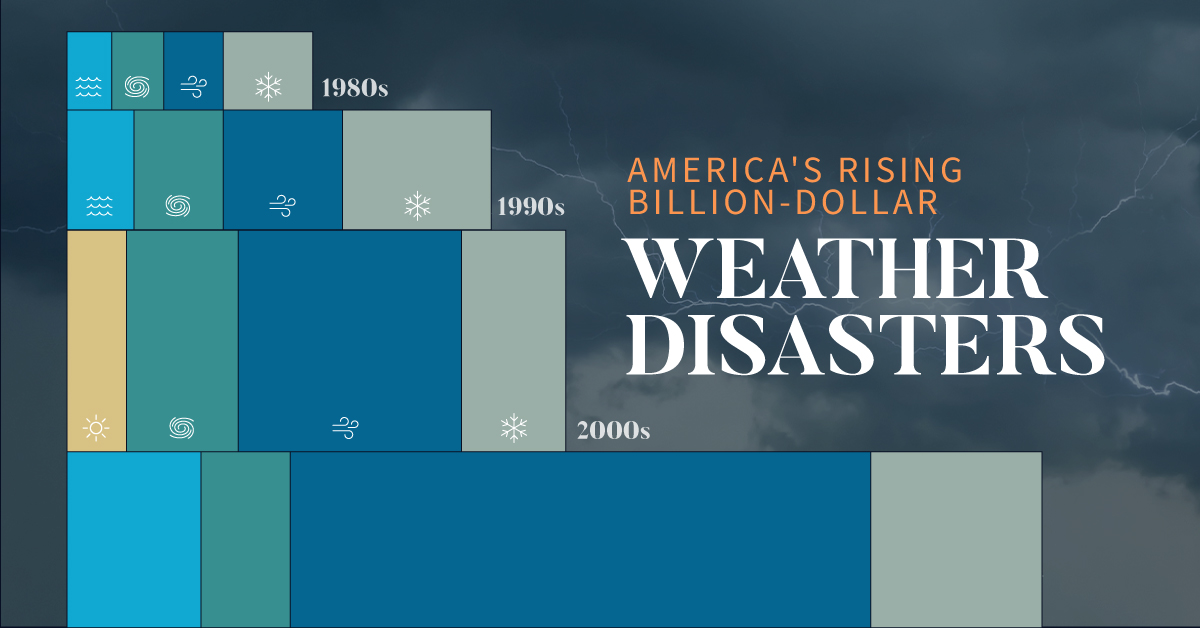
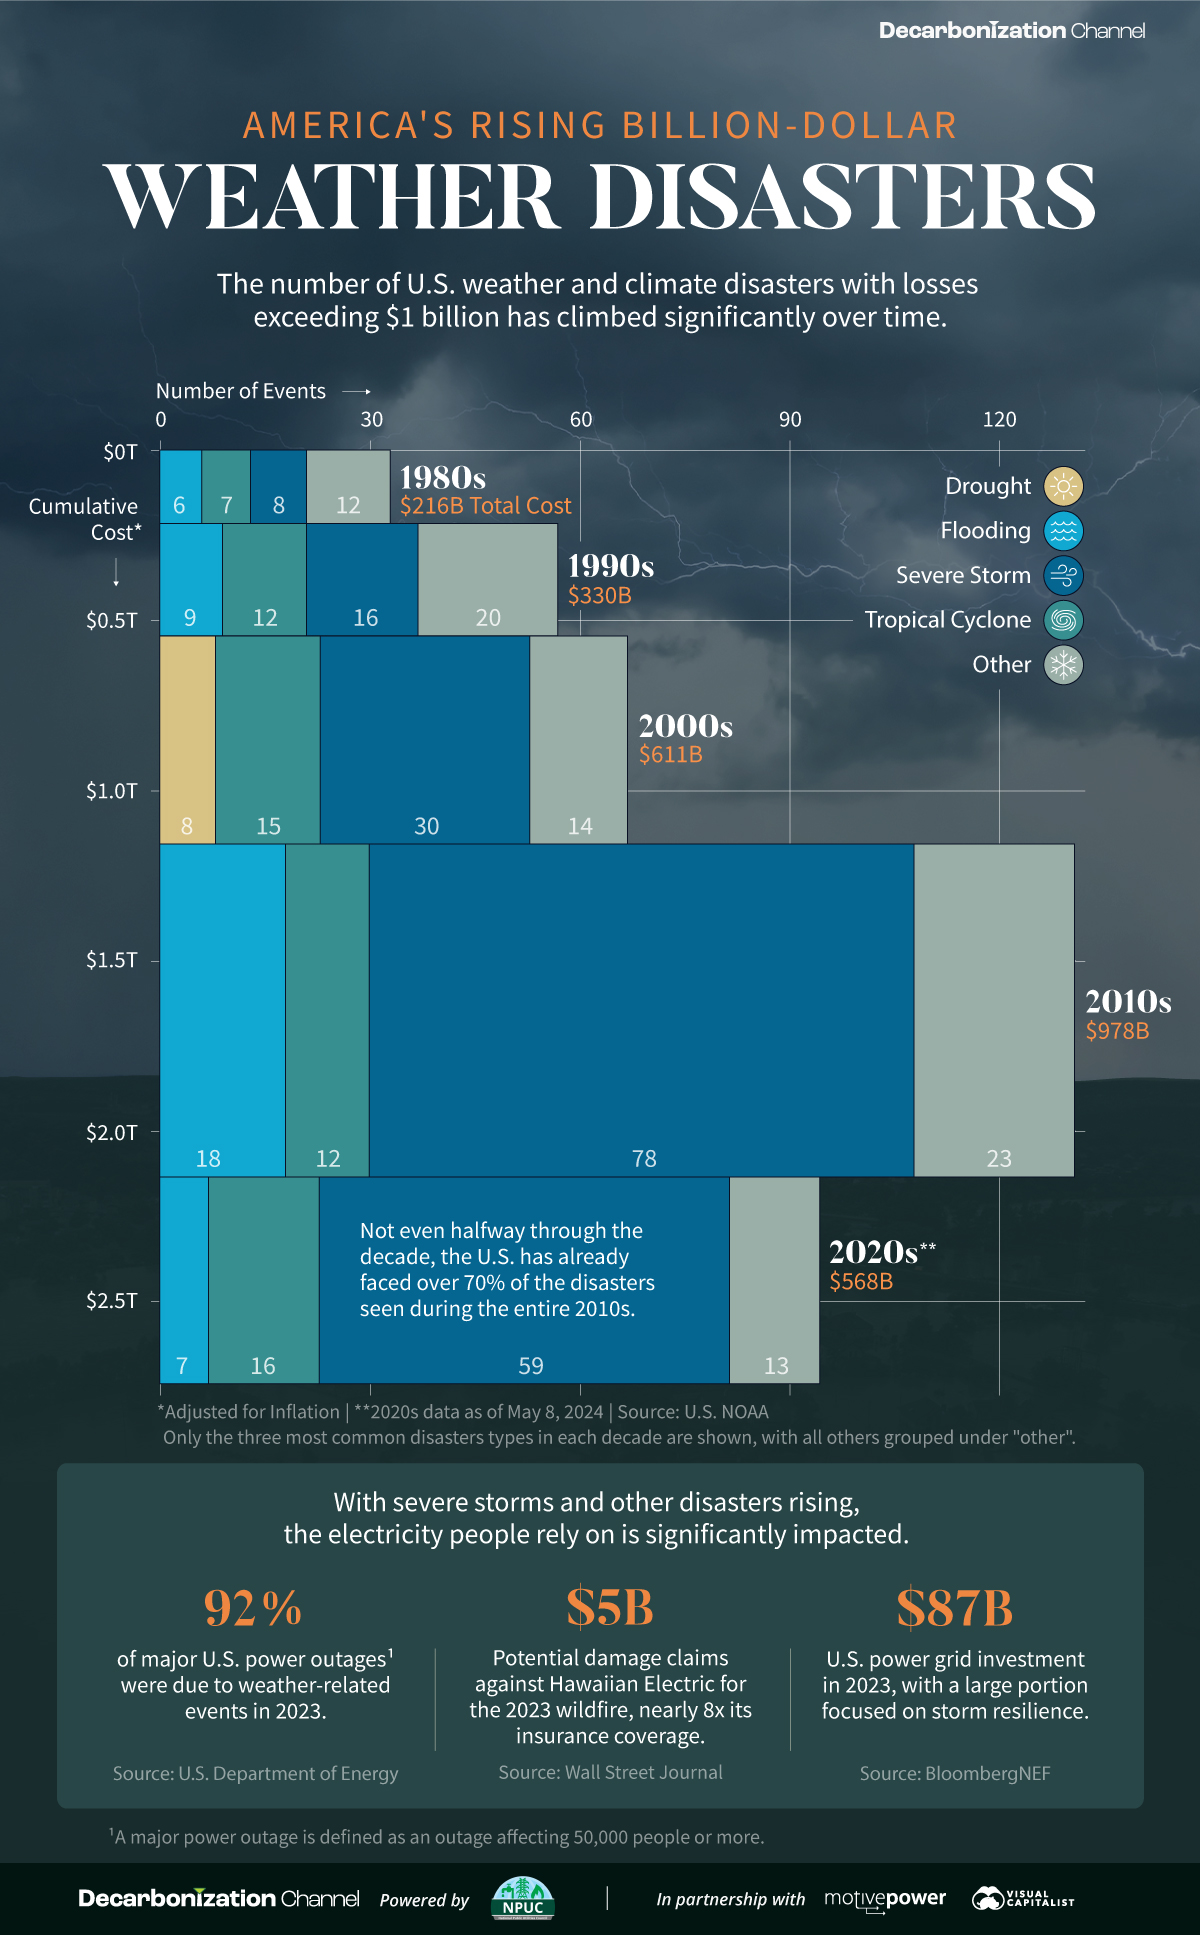
The Rise in U.S. Billion-Dollar Extreme Weather Disasters
Since 1980, there have been 383 extreme weather or climate disasters where the damages reached at least $1 billion. In total, these disasters have cost more than $2.7 trillion.
Created in partnership with the National Public Utilities Council, this chart shows how these disasters have been increasing with each passing decade.
A Growing Concern
The U.S. National Oceanic and Atmospheric Administration (NOAA) tracks each disaster and estimates the cost based on factors like physical damages and time losses such as business interruption. They adjust all costs by the Consumer Price Index to account for inflation.
| Decade | Total No. of Events | Total Inflation-Adjusted Cost |
|---|---|---|
| 1980s | 33 | $216B |
| 1990s | 57 | $330B |
| 2000s | 67 | $611B |
| 2010s | 131 | $978B |
| 2020s* | 95 | $568B |
* Data is as of May 8, 2024.
Both the number and cost of extreme weather disasters has grown over time. In fact, not even halfway through the 2020s the number of disasters is over 70% of those seen during the entire 2010s.
Severe storms have been the most common, accounting for half of all billion-dollar disasters since 1980. In terms of costs, tropical cyclones have caused the lion’s share—more than 50% of the total. Hurricane Katrina, which made landfall in 2005, remains the most expensive single event with $199 billion in inflation-adjusted costs.
Electricity and Extreme Weather Disasters
With severe storms and other disasters rising, the electricity people rely on is significantly impacted. For instance, droughts have been associated with a decline in hydropower, which is an important source of U.S. renewable electricity generation.
Disasters can also lead to significant costs for utility companies. Hawaii Electric faces $5 billion in potential damages claims for the 2023 wildfire, which is nearly eight times its insurance coverage. Lawsuits accuse the company of negligence in maintaining its infrastructure, such as failing to strengthen power poles to withstand high winds.
Given that the utilities industry is facing the highest risk from extreme weather and climate disasters, some companies have begun to prepare for such events. This means taking steps like burying power lines, increasing insurance coverage, and upgrading infrastructure.
Learn how the National Public Utilities Council is working toward the future of sustainable electricity.

-

 Environment2 months ago
Ranked: Top Countries by Total Forest Loss Since 2001
The country with the most forest loss since 2001 lost as much forest cover as the next four countries combined.
-

 Environment4 months ago
Charted: Share of World Forests by Country
We visualize which countries have the biggest share of world forests by area—and while country size plays a factor, so too, does the environment.
-

 Environment4 months ago
Which Countries Have the Largest Forests?
Together, the top five countries with the largest forests account for more than half of the world’s entire forest cover.
-

 Environment5 months ago
Visualized: What Lives in Your Gut Microbiome?
The human gut microbiome contains a world of microbes. We look at the the bacteria that deeply affect our health and well-being.
-

 Environment6 months ago
Mapped: Global Temperature Rise by Country (2022-2100P)
In this set of three maps, we show the global temperature rise on a national level for 2022, 2050, and 2100 based on an analysis by…
-

 Environment6 months ago
Ranked: Per Capita Carbon Emissions by Country
Which countries rank the highest in per capita carbon emissions, and how do they impact the world’s total carbon emissions?


-
 Healthcare1 week ago
Visualizing Daily Protein Sources by Region
-

 Globalization2 weeks ago
Mapped: The Top Exports in Asian Countries
-

 Finance2 weeks ago
Ranked: The World’s 50 Largest Private Equity Firms
-

 United States2 weeks ago
Mapped: The 10 U.S. States With the Lowest Real GDP Growth
-

 United States2 weeks ago
Comparing New and Current U.S. Tariffs on Chinese Imports
-

 China2 weeks ago
Which Countries Have the Most Economic Influence in Southeast Asia?
-

 Demographics2 weeks ago
The Top 25 Nationalities of U.S. Immigrants
-

 Countries2 weeks ago
Ranked: Countries Where Youth are the Most Unhappy, Relative to Older Generations