Misc
Chart: A Global Look at How People Spend Their Time
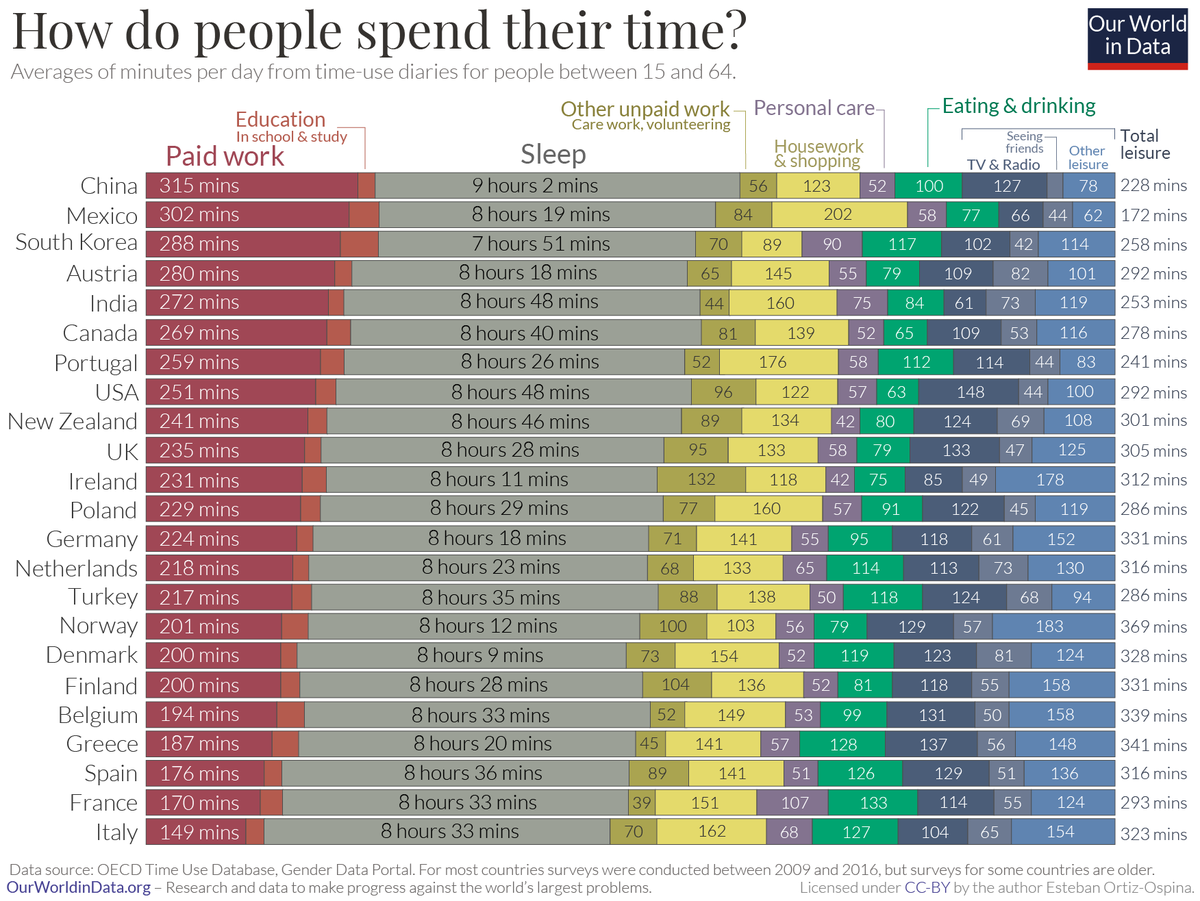
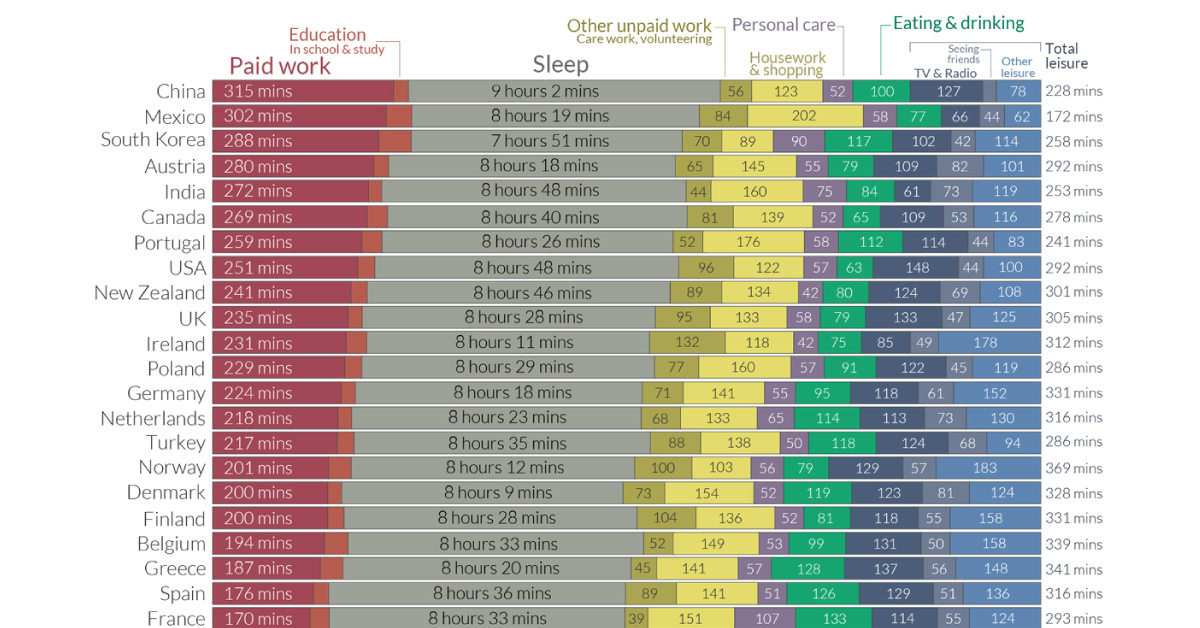
A Global Look at How People Spend Their Time
We all have the same 24 hours in a day, but we don’t spend them the same way. Some prioritize family time or household chores, while others cherish a good night’s sleep or seeing friends.
This chart from Our World in Data compares the average time allocated across various day-to-day activities, from paid work to leisurely activities.
The data for the 33 countries profiled come from the Organization for Economic Co-operation and Development (OECD)’s Time Use database, for ages 15 through 64 years old.
Countries with the Highest Time Spent Per Activity
As the chart shows, basic patterns—work, rest, and play—emerge across the board.
When it comes to paid work, Japan emerges the highest on this list with approximately 5.5 hours per day. However, this country also has some of the highest overtime in a workweek. In contrast, European countries such as France and Spain report nearly half the same hours (less than 3 hours) of paid work per day on average.
Certain trends, however, transcend cultural boundaries. Those in Mexico find themselves spending significant portions of the day (3 hours or more) on housework, as do those in Portugal.
| Activity category | Country with highest time spent | Time spent in minutes |
|---|---|---|
| Paid work | 🇯🇵 Japan | 326 (Approx. 5.5 hrs) |
| Education | 🇰🇷 South Korea | 57 |
| Care for household members | 🇮🇪 Ireland | 61 |
| Housework | 🇲🇽 Mexico | 187 (Approx. 3 hrs) |
| Shopping | 🇩🇪 Germany | 32 |
| Other unpaid work & volunteering | 🇯🇵 Japan | 98 (Approx. 1.5 hrs) |
| Sleep | 🇿🇦 South Africa | 553 (Approx. 9 hrs) |
| Eating | 🇫🇷 France | 133 (Approx. 2 hours) |
| Personal care | 🇫🇷 France | 107 (Approx. 1 hr 45 min) |
| Sports | 🇪🇸 Spain | 42 |
| Attending events | 🇮🇪 Ireland | 42 |
| Seeing friends | 🇿🇦 South Africa | 82 |
| TV and radio | 🇺🇸 U.S. | 148 (Approx. 2.5 hrs) |
| Other leisure (Religious/ civic duties, or unspecified) | 🇳🇴 Norway | 154 (Approx. 2.5 hrs) |
As the saying goes, all work and no play makes Jack a dull boy. In the realm of leisure activities, those in the U.S. spend approximately 2.5 hours consuming media in a day, a number that has risen even higher during the pandemic.
Meanwhile, another interesting cultural pattern is that people in France spend the most time eating, approximately 2 hours per day. These durations are similar to those in other Mediterranean countries such as Greece, Italy, and Spain—perhaps because meals are viewed as a social activity in these cultures.
Gender Disparities in Time Spent
Digging deeper, another way to look at how people spend their time globally is through the lens of gender.
Women spend nearly three times more in unpaid care work compared to men—a whopping total of 1.1 trillion hours each year—which means a lot less leisure time. This inequality is clearly defined by country in the following scatterplot:
In Norway, both men and women have equally high levels of leisure time—though it’s a rare example of such a case.
Meanwhile, in countries like India or China, significant gender gaps prevent women from moving up the socioeconomic ladder, potentially costing trillions of dollars to the global economy.


Mapped: The World’s Largest Armies in 2024
This was originally posted on our Voronoi app. Download the app for free on iOS or Android and discover incredible data-driven charts from a variety of trusted sources.
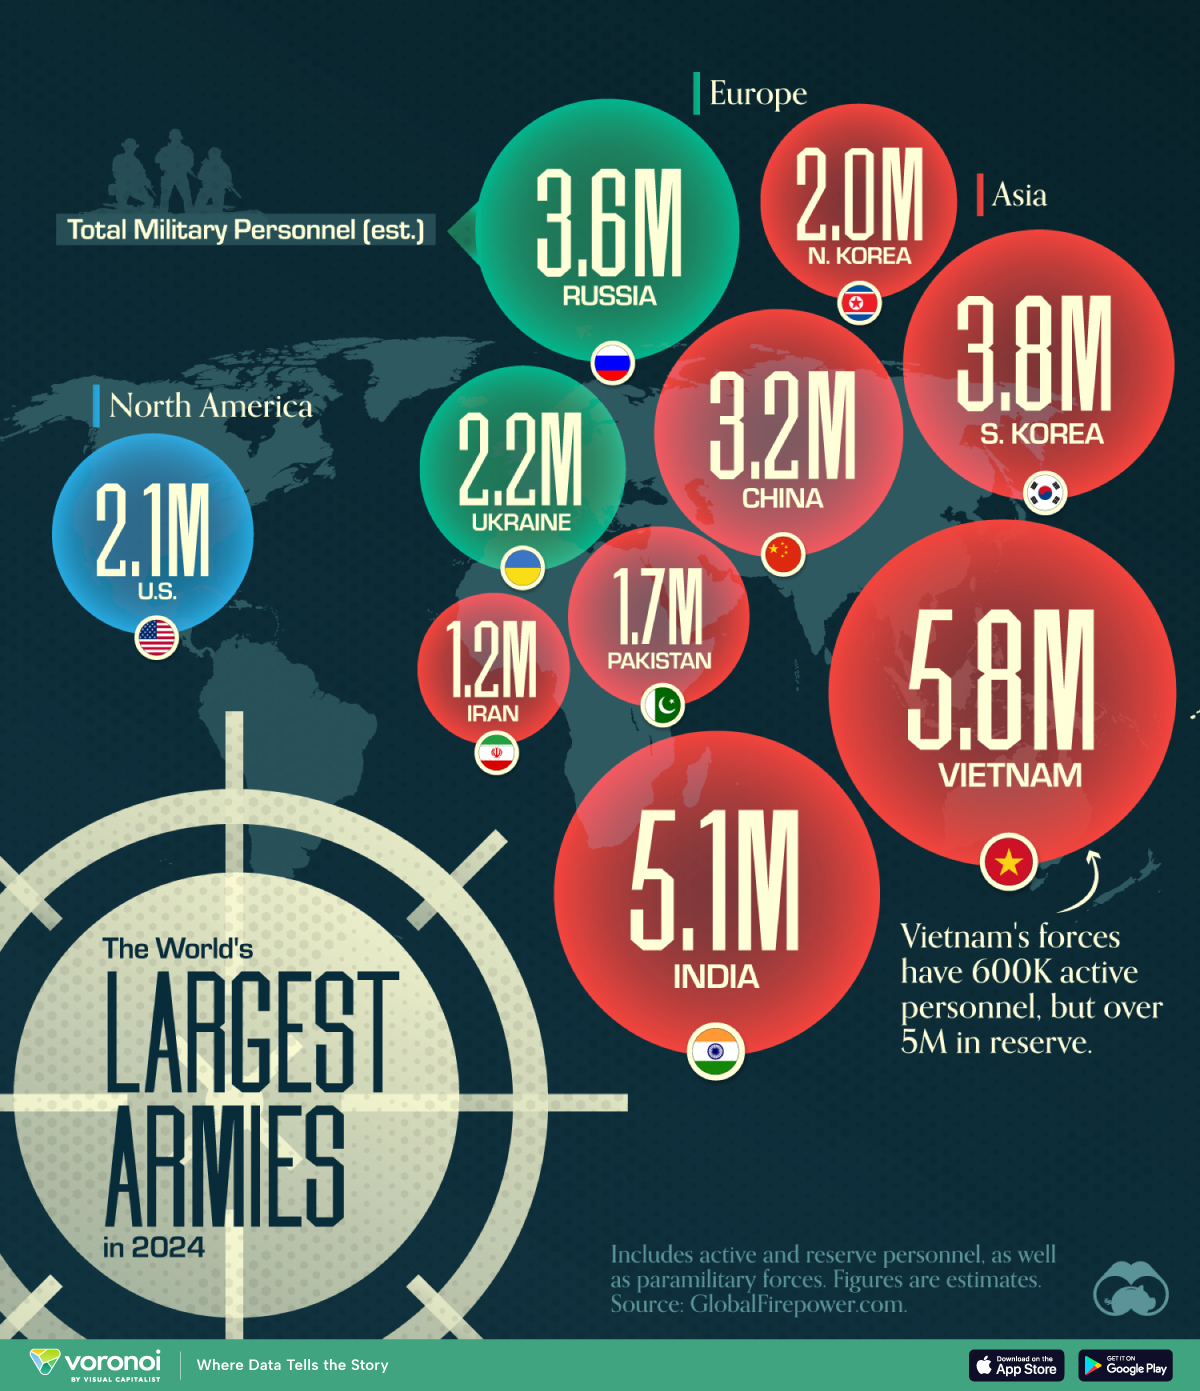
Despite being considered the biggest military force in the world, the United States doesn’t have the largest army in terms of personnel.
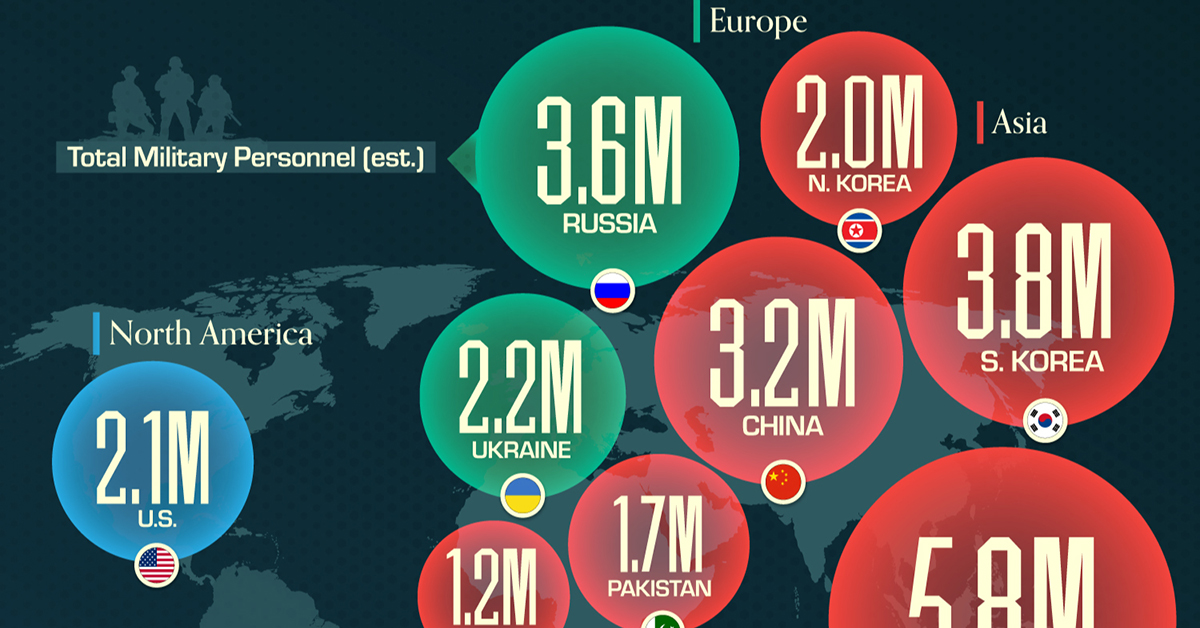
This graphic shows the top 10 countries by military personnel as of May 2024, including active and reserve personnel, as well as paramilitary forces. It is based on estimates from GlobalFirepower.com.
Vietnam, India, and South Korea Have the Biggest Armies
China has the largest standing army, with over 2 million active personnel. With increasing defense spending over the last decades, the country also ranks third in the number of tanks and second in the number of aircraft carriers in service.
When reserve personnel are included, however, the Chinese military falls behind those of Vietnam, India, South Korea, and Russia.
Vietnam’s forces include 600,000 active personnel and over 5 million in reserve. This is because Vietnam, along with countries like South Korea and Israel, has a standing policy of conscription for young adults.
| Country | Total Military Personnel (est.) | Region |
|---|---|---|
| 🇻🇳 Vietnam | 5.8M | Asia |
| 🇮🇳 India | 5.1M | Asia |
| 🇰🇷 South Korea | 3.8M | Asia |
| 🇷🇺 Russia | 3.6M | Europe/Asia |
| 🇨🇳 China | 3.2M | Asia |
| 🇺🇦 Ukraine | 2.2M | Europe |
| 🇺🇸 United States | 2.1M | North America |
| 🇰🇵 North Korea | 2.0M | Asia |
| 🇵🇰 Pakistan | 1.7M | Asia |
| 🇮🇷 Iran | 1.2M | Middle East |
Interestingly, the 2022 Russian invasion of Ukraine resulted in a massive increase in Ukrainian personnel numbers. Active personnel rose from around 170,000 in 2016 to over 900,000.
Despite not having the largest army, the U.S. accounts for almost 40% of global military expenditures, with its 2022 spending totaling $877 billion.
China ranked second in absolute terms, accounting for another 13% of world military expenditure at $292 billion.

-

 Maps1 week ago
Map: Where Are America’s Largest Landfills?
-

 Markets2 weeks ago
Ranked: The World’s 50 Largest Private Equity Firms
-

 Maps2 weeks ago
Mapped: The 10 U.S. States With the Lowest Real GDP Growth
-

 China2 weeks ago
Comparing New and Current U.S. Tariffs on Chinese Imports
-

 Politics2 weeks ago
Which Countries Have the Most Economic Influence in Southeast Asia?
-

 population2 weeks ago
The Top 25 Nationalities of U.S. Immigrants
-

 Countries2 weeks ago
Ranked: Countries Where Youth are the Most Unhappy, Relative to Older Generations
-

 Technology2 weeks ago
Visualizing the 5 Most Common Cybersecurity Mistakes