Green
The Carbon Footprint of the Food Supply Chain
Which Foods Have the Greatest Environmental Impact?
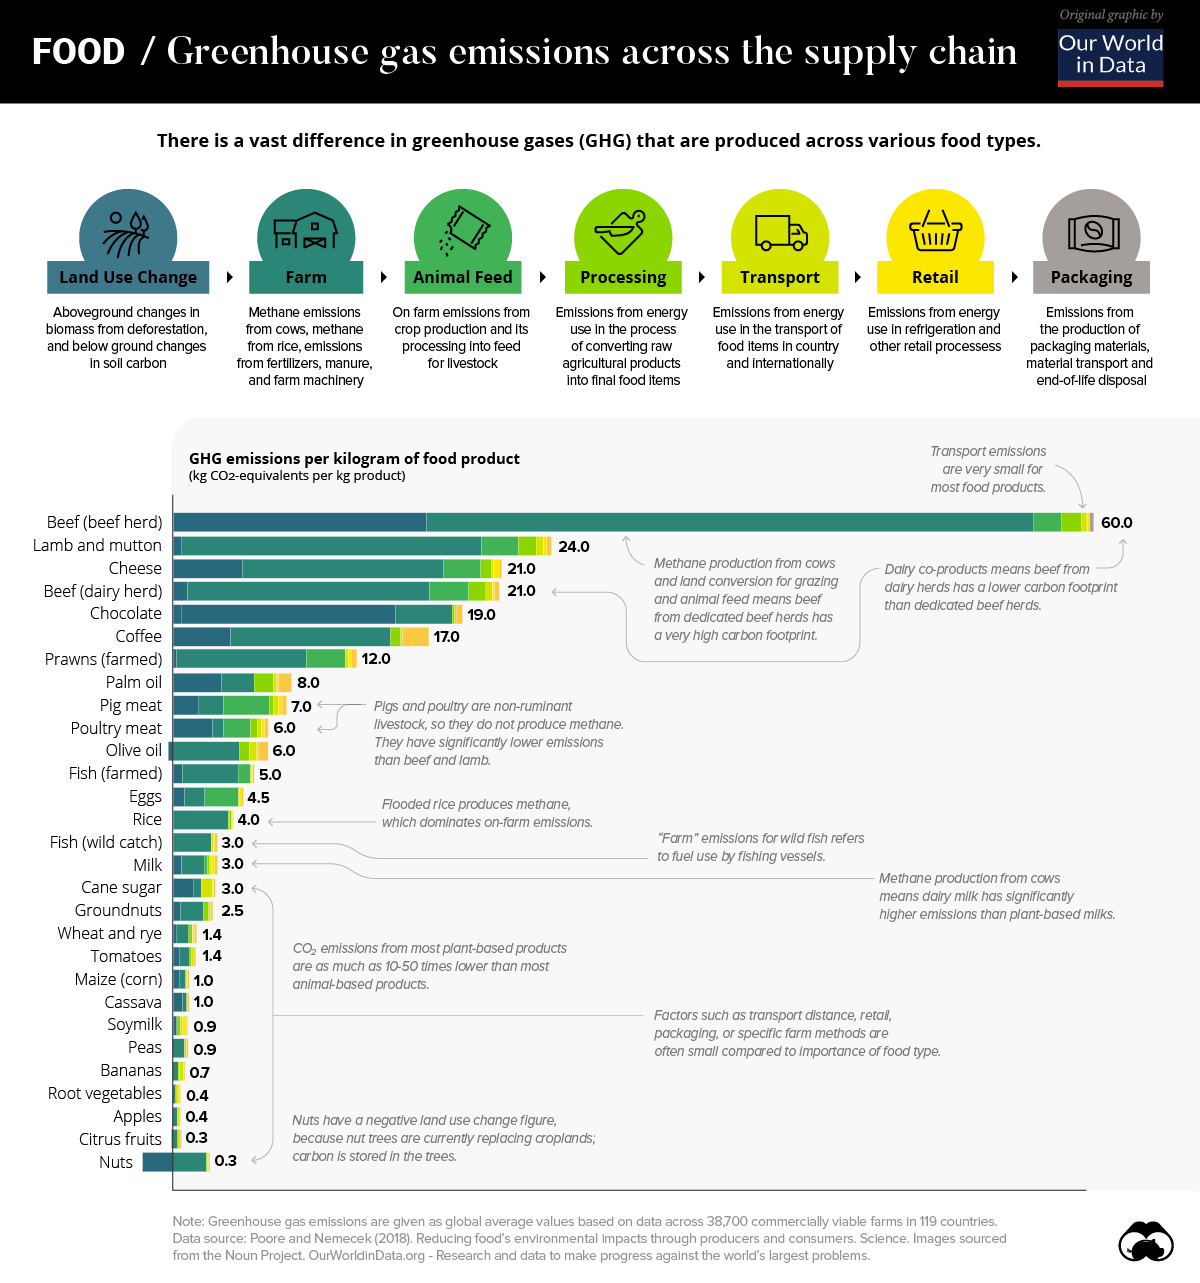
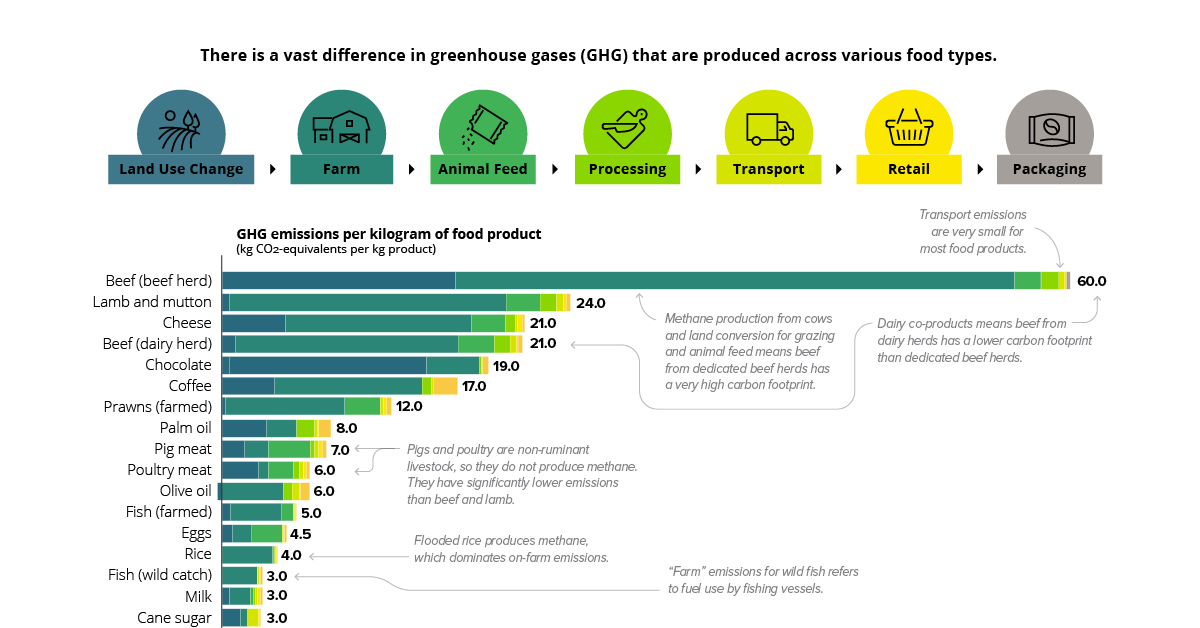
The quantity of greenhouse gases (GHGs) generated by our food can vary considerably across the global food supply chain.
In fact, the difference between specific food types can vary by orders of magnitude, meaning what we eat could be a significant factor impacting GHG emissions on the environment.
Today’s modified chart from Our World in Data relies on data from the largest meta-analysis of food systems in history. The study, published in Science was led by Joseph Poore and Thomas Nemecek to highlight the carbon footprint across different food types across the world.
The Foods With the Highest Carbon Footprint
Worldwide, there are approximately 13.7 billion metric tons of carbon dioxide equivalents (CO2e) emitted through the food supply chain per year.
Across a database extending through 119 countries and 38,000 commercial farms, the study found that, unsurprisingly, beef and other animal products have an outsize effect on emissions.
For example, one kilogram (kg) of beef results in 60 kg of GHG emissions—nearly 2.5x the closest food type, lamb and mutton. In contrast, the same weight of apples produce less than one kilogram of GHG emissions.
| Food Type | GHG Emissions per 1 kg Produced |
|---|---|
| Beef (beef herd) | 60 kgCO2e |
| Lamb & Mutton | 24 kgCO2e |
| Cheese | 21 kgCO2e |
| Beef (dairy herd) | 21 kgCO2e |
| Chocolate | 19 kgCO2e |
| Coffee | 17 kgCO2e |
| Prawns (farmed) | 12 kgCO2e |
| Palm Oil | 8 kgCO2e |
| Pig Meat | 7 kgCO2e |
| Poultry Meat | 6 kgCO2e |
| Olive Oil | 6 kgCO2e |
| Fish (farmed) | 5 kgCO2e |
| Eggs | 4.5 kgCO2e |
| Rice | 4 kgCO2e |
| Fish (wild catch) | 3 kgCO2e |
| Milk | 3 kgCO2e |
| Cane Sugar | 3 kgCO2e |
| Groundnuts | 2.5 kgCO2e |
| Wheat & Rye | 1.4 kgCO2e |
| Tomatoes | 1.4 kgCO2e |
| Maize (Corn) | 1.0 kgCO2e |
| Cassava | 1.0 kgCO2e |
| Soymilk | 0.9 kgCO2e |
| Peas | 0.9 kgCO2e |
| Bananas | 0.7 kgCO2e |
| Root Vegetables | 0.4 kgCO2e |
| Apples | 0.4 kgCO2e |
| Citrus Fruits | 0.3 kgCO2e |
| Nuts | 0.3 kgCO2e |
When it comes to plant-based foods, chocolate is among the highest GHG emitters. One kilogram of chocolate produces 19 kg of GHGs. On average, emissions from plant-based foods are 10 to 50 times lower than animal-based types.
Bottom line, it is clear that the spectrum of emissions differs significantly across each food type.
Food Supply Chain Stages
The food supply chain is complex and nuanced as it moves across each stage of the cycle.
Although the steps behind the supply chain for individual foods can vary considerably, each typically has seven stages:
- Land Use Change
- Farm
- Animal Feed
- Processing
- Transport
- Retail
- Packaging
Across all foods, the land use and farm stages of the supply chain account for 80% of GHG emissions. In beef production, for example, there are three key contributing factors to the carbon footprint at these stages: animal feed, land conversion, and methane production from cows. In the U.S., beef production accounts for 40% of total livestock-related land use domestically.
On the other end of the spectrum is transportation. This stage of the supply chain makes up 10% of total GHG emissions on average. When it comes to beef, the proportion of GHGs that transportation emits is even smaller, at just 0.5% of total emissions.
Contrary to popular belief, sourcing food locally may not help GHG emissions in a very significant way, especially in the case of foods with a large carbon footprint.
The Rise of Plant-Based Alternatives
Amid a growing market share of plant-based alternatives in markets around the world, the future of the food supply chain could undergo a significant transition.
For investors, this shift is already evident. Beyond Meat, a leading provider of meat substitutes, was one of the best performing stocks of 2019—gaining 202% after its IPO in May 2019.
As rising awareness about the environment becomes more prevalent, is it possible that growing meat consumption could be a thing of the past?


Environment
The Rise in America’s Billion-Dollar Extreme Weather Disasters
From tropical cyclones to severe storms, the number of extreme weather disasters with losses exceeding $1 billion has climbed over time.
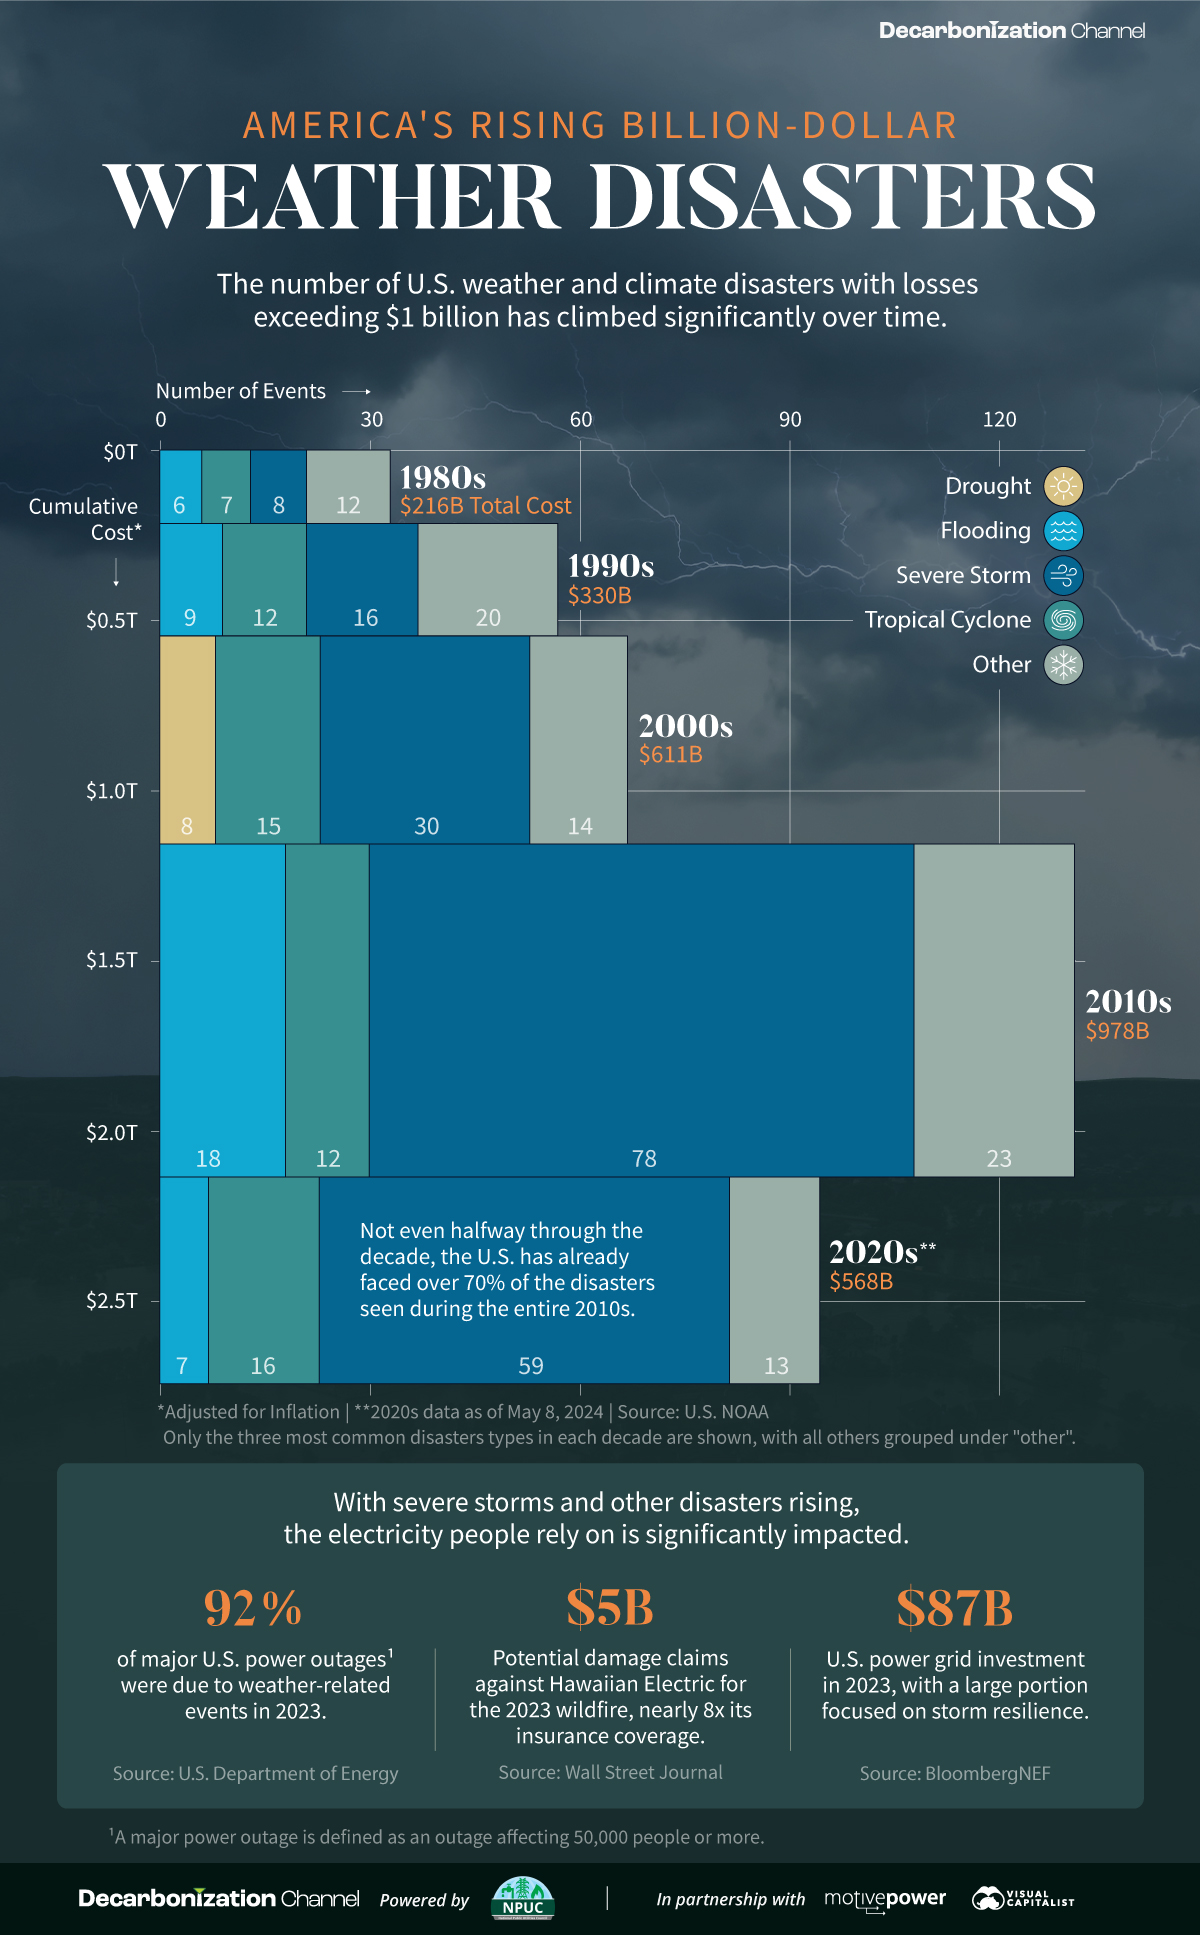
The Rise in U.S. Billion-Dollar Extreme Weather Disasters
Since 1980, there have been 383 extreme weather or climate disasters where the damages reached at least $1 billion. In total, these disasters have cost more than $2.7 trillion.
Created in partnership with the National Public Utilities Council, this chart shows how these disasters have been increasing with each passing decade.
A Growing Concern
The U.S. National Oceanic and Atmospheric Administration (NOAA) tracks each disaster and estimates the cost based on factors like physical damages and time losses such as business interruption. They adjust all costs by the Consumer Price Index to account for inflation.
| Decade | Total No. of Events | Total Inflation-Adjusted Cost |
|---|---|---|
| 1980s | 33 | $216B |
| 1990s | 57 | $330B |
| 2000s | 67 | $611B |
| 2010s | 131 | $978B |
| 2020s* | 95 | $568B |
* Data is as of May 8, 2024.
Both the number and cost of extreme weather disasters has grown over time. In fact, not even halfway through the 2020s the number of disasters is over 70% of those seen during the entire 2010s.
Severe storms have been the most common, accounting for half of all billion-dollar disasters since 1980. In terms of costs, tropical cyclones have caused the lion’s share—more than 50% of the total. Hurricane Katrina, which made landfall in 2005, remains the most expensive single event with $199 billion in inflation-adjusted costs.
Electricity and Extreme Weather Disasters
With severe storms and other disasters rising, the electricity people rely on is significantly impacted. For instance, droughts have been associated with a decline in hydropower, which is an important source of U.S. renewable electricity generation.
Disasters can also lead to significant costs for utility companies. Hawaii Electric faces $5 billion in potential damages claims for the 2023 wildfire, which is nearly eight times its insurance coverage. Lawsuits accuse the company of negligence in maintaining its infrastructure, such as failing to strengthen power poles to withstand high winds.
Given that the utilities industry is facing the highest risk from extreme weather and climate disasters, some companies have begun to prepare for such events. This means taking steps like burying power lines, increasing insurance coverage, and upgrading infrastructure.
Learn how the National Public Utilities Council is working toward the future of sustainable electricity.

-

 Environment2 months ago
Ranked: Top Countries by Total Forest Loss Since 2001
The country with the most forest loss since 2001 lost as much forest cover as the next four countries combined.
-

 Environment4 months ago
Charted: Share of World Forests by Country
We visualize which countries have the biggest share of world forests by area—and while country size plays a factor, so too, does the environment.
-

 Environment4 months ago
Which Countries Have the Largest Forests?
Together, the top five countries with the largest forests account for more than half of the world’s entire forest cover.
-

 Environment5 months ago
Visualized: What Lives in Your Gut Microbiome?
The human gut microbiome contains a world of microbes. We look at the the bacteria that deeply affect our health and well-being.
-

 Environment6 months ago
Mapped: Global Temperature Rise by Country (2022-2100P)
In this set of three maps, we show the global temperature rise on a national level for 2022, 2050, and 2100 based on an analysis by…
-

 Environment6 months ago
Ranked: Per Capita Carbon Emissions by Country
Which countries rank the highest in per capita carbon emissions, and how do they impact the world’s total carbon emissions?

-
 Healthcare1 week ago
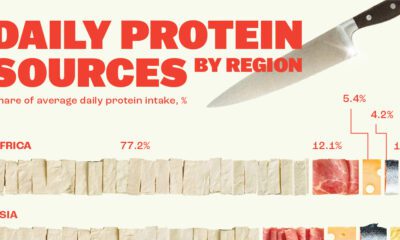
Visualizing Daily Protein Sources by Region
-

 Globalization2 weeks ago
Mapped: The Top Exports in Asian Countries
-

 Finance2 weeks ago
Ranked: The World’s 50 Largest Private Equity Firms
-

 United States2 weeks ago
Mapped: The 10 U.S. States With the Lowest Real GDP Growth
-

 United States2 weeks ago
Comparing New and Current U.S. Tariffs on Chinese Imports
-

 China2 weeks ago
Which Countries Have the Most Economic Influence in Southeast Asia?
-

 Demographics2 weeks ago
The Top 25 Nationalities of U.S. Immigrants
-

 Countries2 weeks ago
Ranked: Countries Where Youth are the Most Unhappy, Relative to Older Generations