

Energy Shift
Visualizing the World’s Largest Oil Producers


The World’s Largest Oil Producers
The world is in the middle of the first energy crisis of the 21st century.
High energy prices, especially for oil, gas, and coal, are driving decades-high inflation in various countries, some of which are also experiencing energy shortages. Russia’s recent invasion of Ukraine has exacerbated the crisis, given that the country is both a major producer and exporter of oil and natural gas.
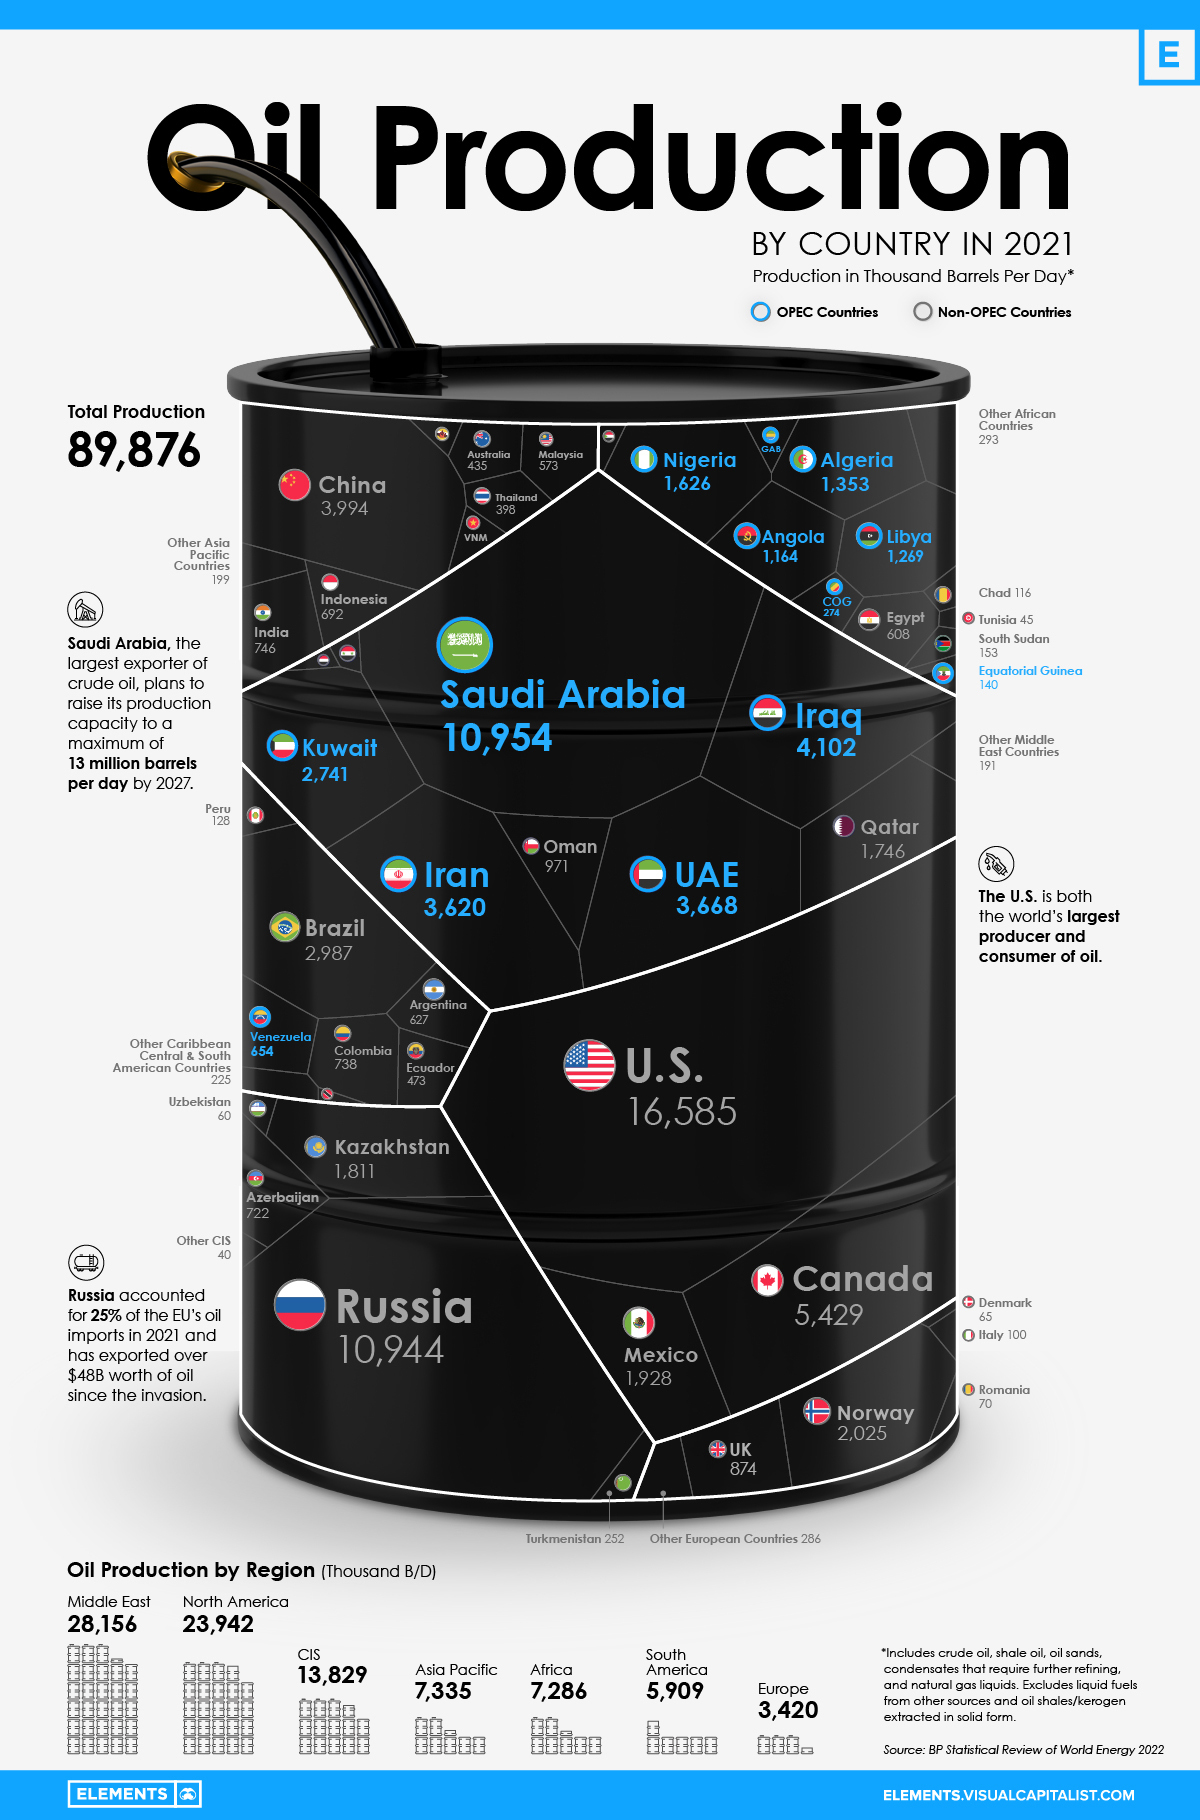
Using data from BP’s Statistical Review of World Energy, the above infographic provides further context on the crisis by visualizing the world’s largest oil producers in 2021.
Oil Production: OPEC Countries vs. Rest of the World
Before looking at country-level data, it’s worth seeing the amount of oil the Organization of Petroleum Exporting Countries (OPEC) produces compared to other organizations and regions.
| Region/Organization | 2021 Oil Production (barrels per day) | % of Total |
|---|---|---|
| OPEC | 31.7M | 35% |
| North America | 23.9M | 27% |
| Commonwealth of Independent States (CIS) | 13.8M | 15% |
| Rest of the World | 20.5M | 23% |
| Total | 89.9M | 100% |
The OPEC countries are the largest oil producers collectively, with Saudi Arabia alone making up one-third of OPEC production. It’s also important to note that OPEC production remains below pre-pandemic levels after the organization reduced its output by an unprecedented 10 million barrels per day (B/D) in 2020.
Following the OPEC countries, the U.S., Canada, and Mexico accounted for just over a quarter of global oil production in 2021. Nearly 70% of North American oil production came from the U.S., the world’s largest oil producer.
Similarly, within the CIS—an organization of post-Soviet Union countries—Russia was by far the largest producer, accounting for 80% of total CIS production.
The Largest Oil Producers in 2021
Roughly 43% of the world’s oil production came from just three countries in 2021—the U.S., Saudi Arabia, and Russia. Together, these three countries produced more oil than the rest of the top 10 combined.
| Country | 2021 Oil Production (barrels per day) | % of Total |
|---|---|---|
| U.S. 🇺🇸 | 16.6M | 18.5% |
| Saudi Arabia 🇸🇦 | 11M | 12.2% |
| Russian Federation 🇷🇺 | 10.9M | 12.2% |
| Canada 🇨🇦 | 5.4M | 6.0% |
| Iraq 🇮🇶 | 4.1M | 4.6% |
| China 🇨🇳 | 4.0M | 4.4% |
| United Arab Emirates 🇦🇪 | 3.7M | 4.1% |
| Iran 🇮🇷 | 3.6M | 4.0% |
| Brazil 🇧🇷 | 3.0M | 3.3% |
| Kuwait 🇰🇼 | 2.7M | 3.0% |
| Norway 🇳🇴 | 2.0M | 2.3% |
| Mexico 🇲🇽 | 1.9M | 2.1% |
| Kazakhstan 🇰🇿 | 1.8M | 2.0% |
| Qatar 🇶🇦 | 1.7M | 1.9% |
| Nigeria 🇳🇬 | 1.6M | 1.8% |
| Algeria 🇩🇿 | 1.4M | 1.5% |
| Libya 🇱🇾 | 1.3M | 1.4% |
| Angola 🇦🇴 | 1.2M | 1.3% |
| Oman 🇴🇲 | 0.97M | 1.1% |
| United Kingdom 🇬🇧 | 0.87M | 1.0% |
| India 🇮🇳 | 0.75M | 0.8% |
| Colombia 🇨🇴 | 0.74M | 0.8% |
| Azerbaijan 🇦🇿 | 0.72M | 0.8% |
| Indonesia 🇮🇩 | 0.69M | 0.8% |
| Venezuela 🇻🇪 | 0.65M | 0.7% |
| Argentina 🇦🇷 | 0.63M | 0.7% |
| Egypt 🇪🇬 | 0.60M | 0.7% |
| Malaysia 🇲🇾 | 0.57M | 0.6% |
| Ecuador 🇪🇨 | 0.47M | 0.5% |
| Australia 🇦🇺 | 0.44M | 0.5% |
| Thailand 🇹🇭 | 0.39M | 0.4% |
| Republic of Congo 🇨🇬 | 0.27M | 0.3% |
| Turkmenistan 🇹🇲 | 0.25M | 0.3% |
| Vietnam 🇻🇳 | 0.19M | 0.2% |
| Gabon 🇬🇦 | 0.18M | 0.2% |
| South Sudan 🇸🇩 | 0.15M | 0.2% |
| Equatorial Guinea 🇬🇳 | 0.14M | 0.2% |
| Peru 🇵🇪 | 0.13M | 0.1% |
| Chad 🇹🇩 | 0.12M | 0.1% |
| Brunei 🇧🇳 | 0.10M | 0.1% |
| Italy 🇮🇹 | 0.10M | 0.1% |
| Syria 🇸🇾 | 0.10M | 0.1% |
| Trinidad & Tobago 🇹🇹 | 0.08M | 0.1% |
| Romania 🇷🇴 | 0.07M | 0.1% |
| Yemen 🇾🇪 | 0.07M | 0.1% |
| Denmark 🇩🇰 | 0.07M | 0.1% |
| Sudan 🇸🇩 | 0.06M | 0.1% |
| Uzbekistan 🇺🇿 | 0.06M | 0.1% |
| Tunisia 🇹🇳 | 0.05M | 0.1% |
| Rest of the World 🌍 | 1.2M | 1.4% |
| Total | 89.9M | 100.0% |
Over the last few decades, U.S. oil production has been on a rollercoaster of troughs and peaks. After falling from its 1970 peak of 11.3 million B/D, it reached a historic low of 6.8 million B/D in 2008. However, following a turnaround in the 2010s, the country has since surpassed Saudi Arabia as the largest oil producer. As of 2021, though, the U.S. remained a net importer of crude oil while exporting refined petroleum products.
Saudi Arabia and Russia each produced roughly 11 million B/D in 2021 and were the two largest oil exporters globally. In both countries, state-owned oil firms (Saudi Aramco and Gazprom, respectively) were the most valuable oil and gas producing companies.
From Europe (excluding Russia), only Norway made the top 15 oil producers, accounting for 2.3% of global production. The lack of regional output partly explains the European Union’s dependence on Russian oil and gas, worsening the region’s energy crisis.
How the Energy Crisis is Affecting Oil Production
After a deep dive in 2020, oil demand is resurfacing and is now above pre-pandemic levels. Furthermore, supply constraints due to sanctions on Russian oil and gas tighten the market and support high oil prices.
While the impact has been felt globally, European countries have been hit hard due to their reliance on Russia’s fossil fuel exports, with some getting almost all of their energy fuels from Russia.
To combat the oil crunch, the rest of the world is ramping up oil supply through increased production or releasing strategic petroleum reserves (SPRs). U.S. oil production is expected to rise by 1 million B/D in 2022 to a record-high. Simultaneously, Western nations are calling on OPEC members to increase their output to ease prices. However, OPEC nations are sticking to their planned production hikes, with output still below early 2020 levels.
“We had a good discussion on ensuring global energy security and adequate oil supplies to support global economic growth. And that will begin shortly.”– U.S. President Joe Biden on his recent visit to Saudi Arabia
The U.S. is releasing 180 million barrels of oil from its SPR, of which 60 million barrels will contribute to the IEA’s collective release of 120 million barrels. But with oil demand expected to reach a new all-time high in 2023, it remains to be seen whether these efforts to increase supply will be enough to curb the crunch.


Energy Shift
Visualized: The Growth of Clean Energy Stocks
Visual Capitalist partnered with EnergyX to analyze five major clean energy stocks and explore the factors driving this growth.
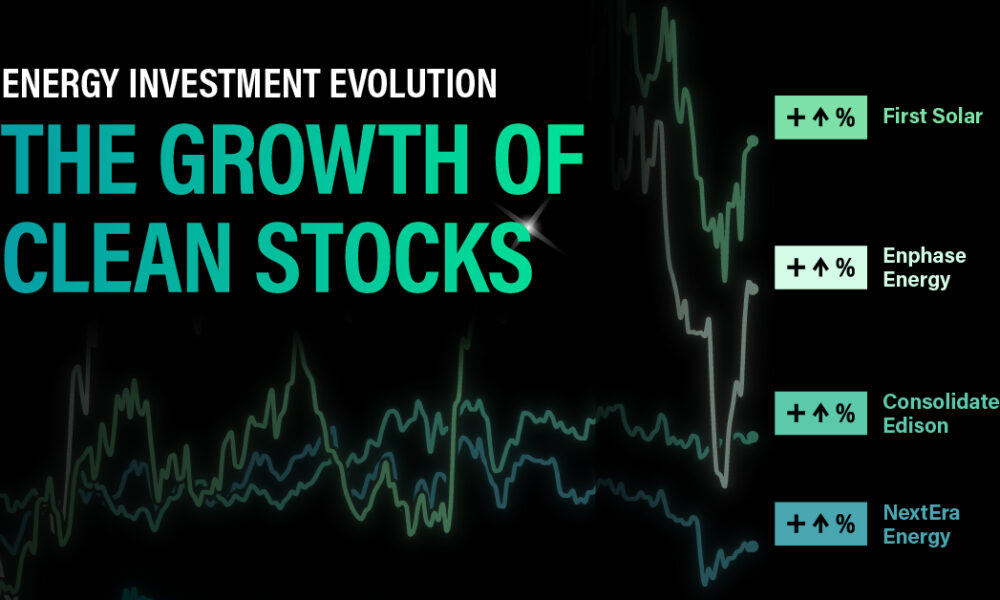
The Growth of Clean Energy Stocks
Over the last few years, energy investment trends have shifted from fossil fuels to renewable and sustainable energy sources. Long-term energy investors now see significant returns from clean energy stocks, especially compared to those invested in fossil fuels alone.
For this graphic, Visual Capitalist has collaborated with EnergyX to examine the rise of clean energy stocks and gain a deeper understanding of the factors driving this growth.
Sustainable Energy Stock Performance
In 2023, the IEA reported that 62% of all energy investment went toward sustainable sources. As the world embraces sustainable energy and technologies like EVs, it’s no surprise that clean energy companies provide solid returns for their investors over long periods.
Taking the top-five clean energy stocks by market cap (as of April 2024) and charting their five-year cumulative returns, it is clear that investments in clean energy are growing:
| Company | Price: 01/04/2019 | Price: 12/29/2024 | 5-Year-Return % |
|---|---|---|---|
| First Solar, Inc. | $46.32 | $172.28 | 272% |
| Enphase Energy, Inc. | $5.08 | $132.14 | 2,501% |
| Consolidated Edison, Inc. | $76.55 | $90.97 | 19% |
| NextEra Energy, Inc. | $43.13 | $60.74 | 41% |
| Brookfield Renewable Partners | $14.78 | $26.28 | 78% |

But how does this compare to the performance of fossil fuel stocks?
When comparing the performance of the S&P Global Oil Index and the S&P Clean Energy Index between 2019 and 2023, we see that the former returned 15%, whereas the latter returned an impressive 41%. This trend demonstrates the potential for clean energy stocks to yield significant returns on an industry level, sparking optimism and excitement for potential investors.
A Shift In Returns
With global investment trends moving away from traditional, non-sustainable sources, the companies that could shape the energy transition provide investors with alternative opportunities and avenues for growth.
One such company is EnergyX. The lithium technology company has patented a groundbreaking technology that can improve lithium extraction rates by an incredible 300%, and its stock price has grown tenfold since its first offering in 2021.

Energy Shift
Visualized: A Decade of Clean Energy Investment
In this graphic, Visual Capitalist has partnered with EnergyX to explore the growth of global clean energy investment.
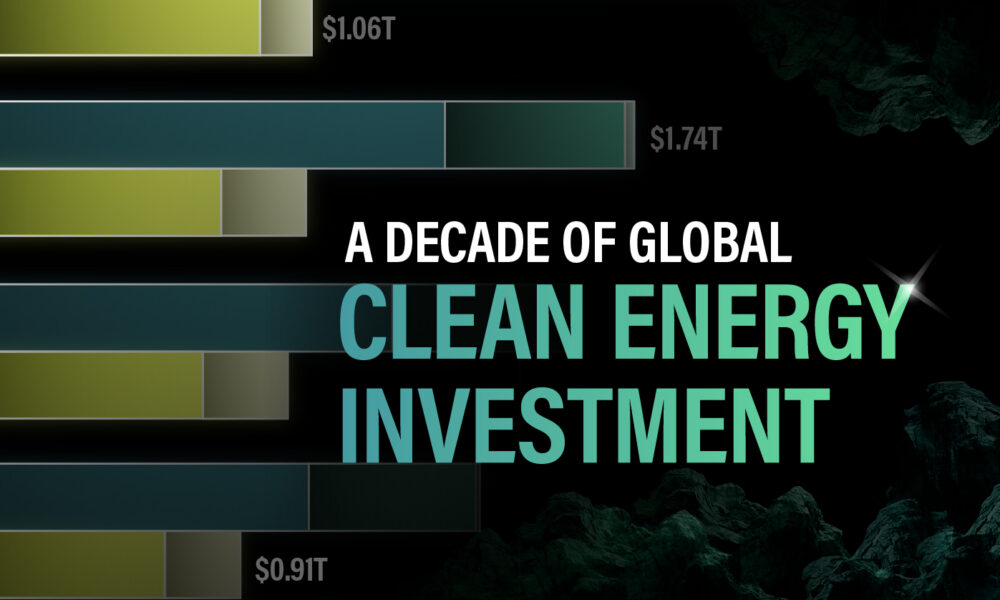
Visualized: A Decade of Clean Energy Investment
Global energy investment is growing every year. But recently, investments in clean energy have been significantly outpacing investments in fossil fuels.
For this graphic, we partnered with EnergyX to explore how global energy investment has changed and learn how investments in clean energy are starting to pay off for their investors.
The Rise of Sustainable Energy Investment
Propelled by various climate initiatives such as the Paris Agreement and the widespread adoption of EVs, global investment in sustainable energy surged to over $1.7 trillion in 2023, the highest ever, and the IEA projects that this growth could continue:
| Energy Product | 2020 | 2021 | 2022 | 2023 | 2030F |
|---|---|---|---|---|---|
| Clean Electrification | $0.97T | $1.05 | $1.21T | $1.34T | $1.65T |
| Low-Emission Fuels | $0.01T | $0.01 | $0.01T | $0.02T | $0.05T |
| Energy Efficiency | $0.28T | $0.35 | $0.39T | $0.38T | $0.49T |
| Clean Energy Total | $1.26T | $1.41T | $1.61T | $1.74T | $2.19T |
| Natural Gas | $0.26T | $0.27T | $0.31T | $0.32T | $0.35T |
| Oil | $0.42T | $0.48T | $0.52T | $0.55T | $0.60T |
| Coal | $0.16T | $0.16T | $0.18T | $0.18T | $0.11T |
| Fossil Fuel Total | $0.84T | $0.91T | $1.01T | $1.05T | $1.06T |
| Total Energy Investment | $2.10T | $2.32T | $2.62T | $2.79T | $3.25T |
Between 2020 and 2030, global investment in sustainable energy could increase by 74% to nearly $2.2 trillion, compared to just 26% additional investment in fossil fuels, with a forecast total of $1.06 trillion. This shows that sustainability is the future of energy investment.
Sustainable Investor Success Stories
While the growing investments in clean energy show that the world embraces sustainability, energy investors will still look for decent returns. Now, in 2024, clean energy investments are beginning to bear fruit. Here are just a few examples:
- Between 2019 and 2023, Tesla had a cumulative return of 1,073%
- NextEra Energy’s quarterly dividend increased by over 10% as of February 2024
- Investors in EnergyX have 10x’ed their investments since the company’s first offering in 2021
Lithium plays a critical role in powering electric vehicles (EVs) and facilitating the transition to sustainable energy. EnergyX has patented technology that enhances lithium extraction rates by up to 300%, contributing to meeting the growing demand for lithium and fueling the EVs of the future.

-

 Electrification3 years ago
Ranked: The Top 10 EV Battery Manufacturers
-

 Electrification2 years ago
The Key Minerals in an EV Battery
-

 Real Assets3 years ago
The World’s Top 10 Gold Mining Companies
-

 Electrification3 years ago
Mapped: Solar Power by Country in 2021
-

 Misc3 years ago
All the Metals We Mined in One Visualization
-

 Energy Shift2 years ago
What Are the Five Major Types of Renewable Energy?
-

 Electrification2 years ago
The World’s Largest Nickel Mining Companies
-

 Misc3 years ago
The Largest Copper Mines in the World by Capacity