Culture
Animated Chart: The Rise and Fall of Music Sales, by Format (1973-2021)
Article/Editing:
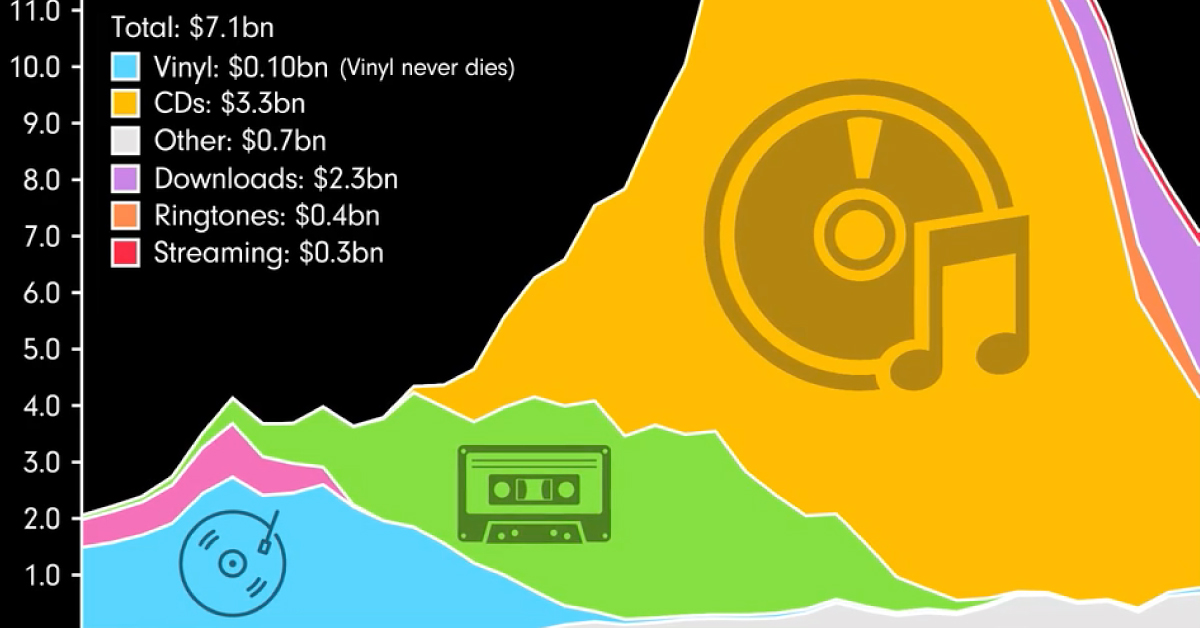
The Rise and Fall of Music Sales, by Format (1973-2021)
We live in a world of music. Whether when driving to work or jamming out at home, people around the world like to have their favorite tunes playing in the background.
But while our love for music has been constant, the way we consume media has evolved drastically. The past 50 years have seen many different music formats used to access these tunes, mirroring society’s shift from analog to digital.
This video, created by James Eagle using data from the Recording Industry Association of America (RIAA), highlights sales of different music formats in the U.S. over the last 50 years.
Vinyl
Up until the late 1980s, vinyl dominated the music format industry, earning billions of dollars in sales annually. Records of Bruce Springsteen’s Born to Run or Pink Floyd’s Dark Side of the Moon were some of the top selling albums available.
Vinyl is said to provide its listeners with analog sounds that reverberate and the warm notes of almost-live music. For vinyl users and enthusiasts to this day, the music produced by these sleek yet massive records is unparalleled.
8-Track
If you’re a millennial (or younger), you may have never heard of the 8-track. But this music format played an integral part in the history of music.
When the booming automotive vehicle industry found it challenging to translate the music experience to cars using vinyl, it looked to the “Stereo 8” eight-track cartridge, better known as the 8-track. This cartridge used an analog magnetic tape and provided 90 minutes of continuous music play time.
8-track carved a niche for itself much before the advent of cassettes and CDs. And through the proliferation of vehicles, 8-track sales climbed to reach a peak revenue of $900 million in 1978.
Cassettes
The era of cassettes pushed 8-tracks into the history of music in the early 1980s. These pocket-sized tapes were more convenient to use than 8Tracks and quickly spread worldwide.
By 1989, the cassette format reached its peak revenues of $3.7 billion.
CDs
First released in 1982, the Compact Disc or CD came into the music market as the successor to the vinyl record.
Developed by Philips and Sony, sales of the sleek and portable CD grew quickly as home and car stereos alike added CD functionality. The format brought in $13.3 billion in revenue in both 1999 and 2000. To date, no other music format has reached the same milestone since.
Digital Music Formats
When it comes to preferred music formats over time, convenience (and cost) seem to have been the biggest catalysts of change.
From the start of the early 2000s, CDs had started to be replaced by other forms of digital storage and distribution. The massive shift to internet consumption and the introduction of digital music, available through downloads, pushed audio CD sales down rapidly.
The launch of streaming platforms like Spotify in 2006 exacerbated this decline, with CD sales dropping by around $4 billion in five years.
Digital sales continued to evolve. Ringtone sales alone brought in $1.1 billion in 2007, and in 2012, the revenues from downloads shot up to a peak of $2.9 billion. But music streaming platforms kept climbing through 2021, and will likely continue to be the future face of music consumption.
| Rank | Music formats | Revenue in 2021 |
|---|---|---|
| 1 | Streaming | $11.5 billion |
| 2 | Vinyl | $1.0 billion |
| 3 | CD | $0.6 billion |
| 4 | Downloads | $0.5 billion |
| Other | $1.4 billion | |
| Total | $15.1 billion |
Music streaming and subscription services pushed the accessibility of music to new highs, especially with free ad-supported platforms.
In 2021, streaming secured the music industry a whopping $11.5 billion in sales, good for 76% of the total. If it keeps growing in popularity and accessibility, the format could potentially challenge the peak popularity of CDs in the late 90s.
The Vintage Comeback?
There’s no doubt that digital music formats are getting increasingly popular with every passing year. However, one of our vintage and beloved music formats—the vinyl record—seems to be making a comeback.
According to the RIAA database, the revenue earned by LP/EP sales has shot up to $1.0 billion in 2021, its highest total since the mid-1980s.

This article was published as a part of Visual Capitalist's Creator Program, which features data-driven visuals from some of our favorite Creators around the world.


Demographics
Ranked: Countries Where Youth are the Most Unhappy, Relative to Older Generations
Conventional wisdom says that young adults (those below 30) tend to be the happiest demographic—but this is not true for these countries.
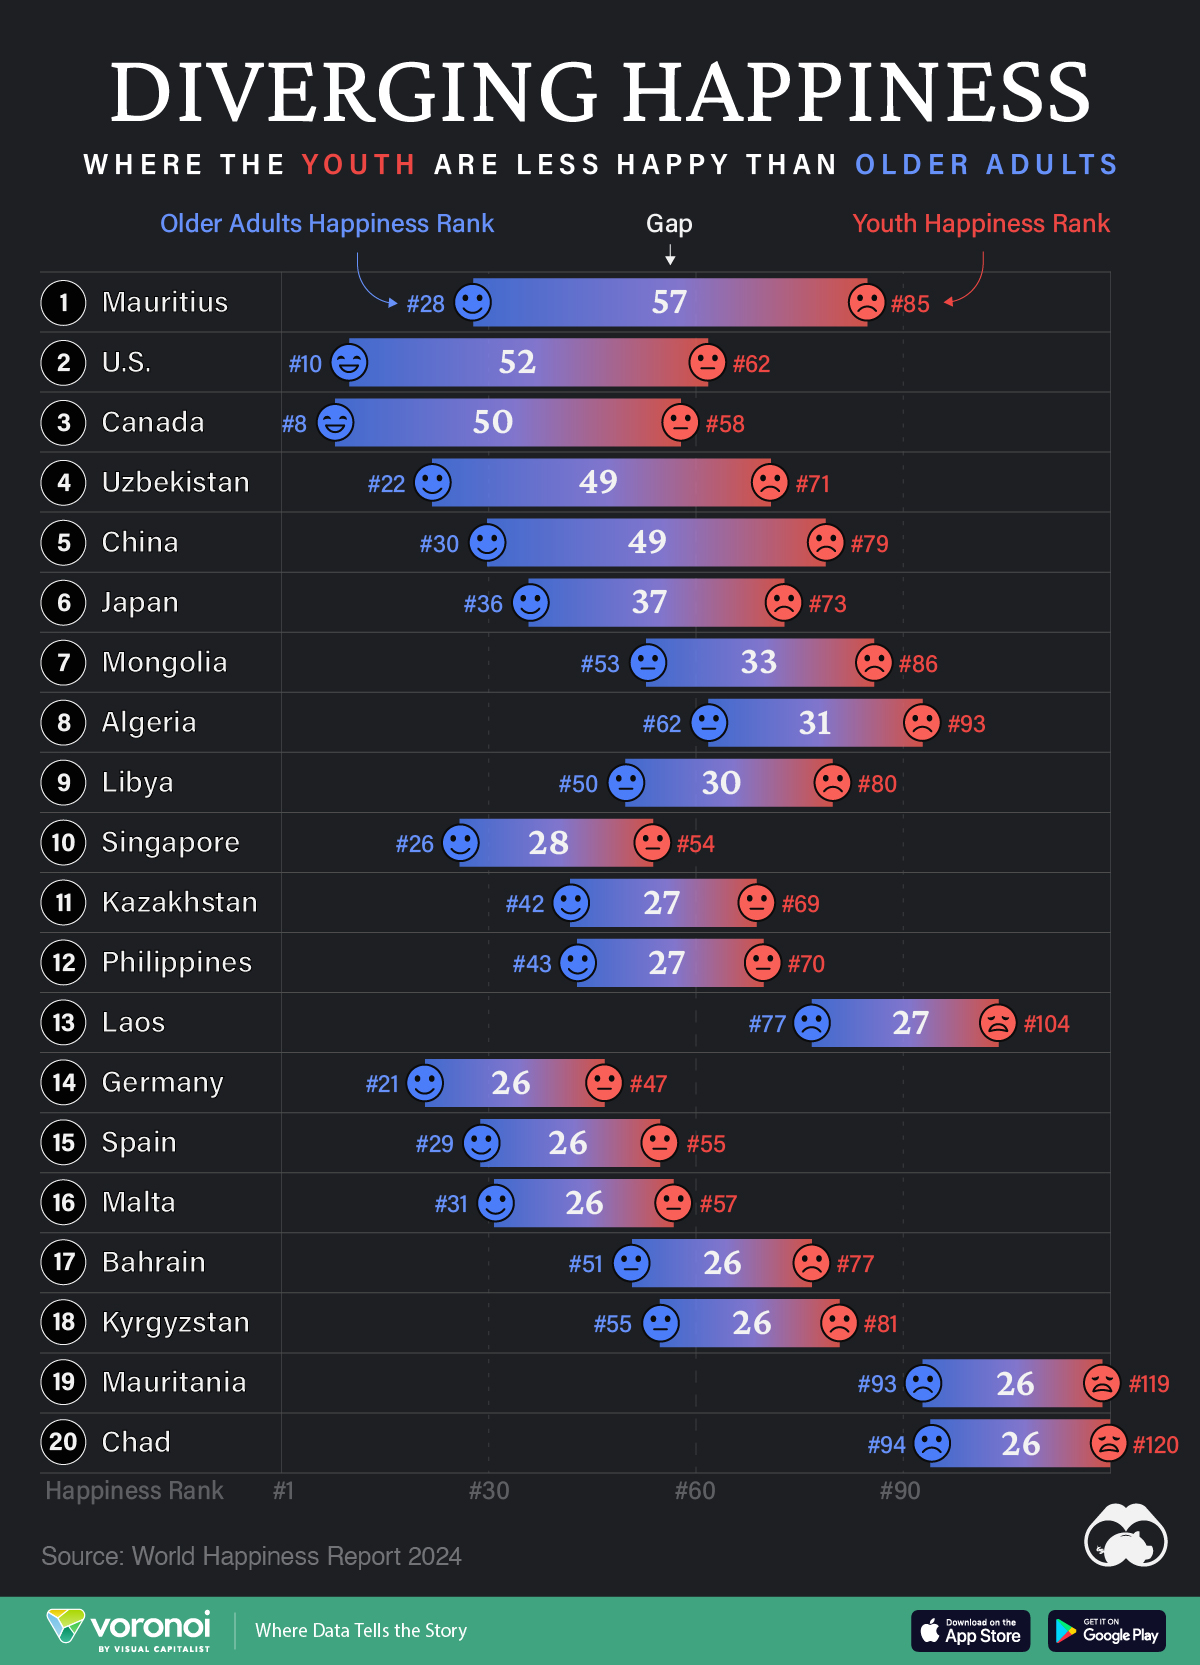
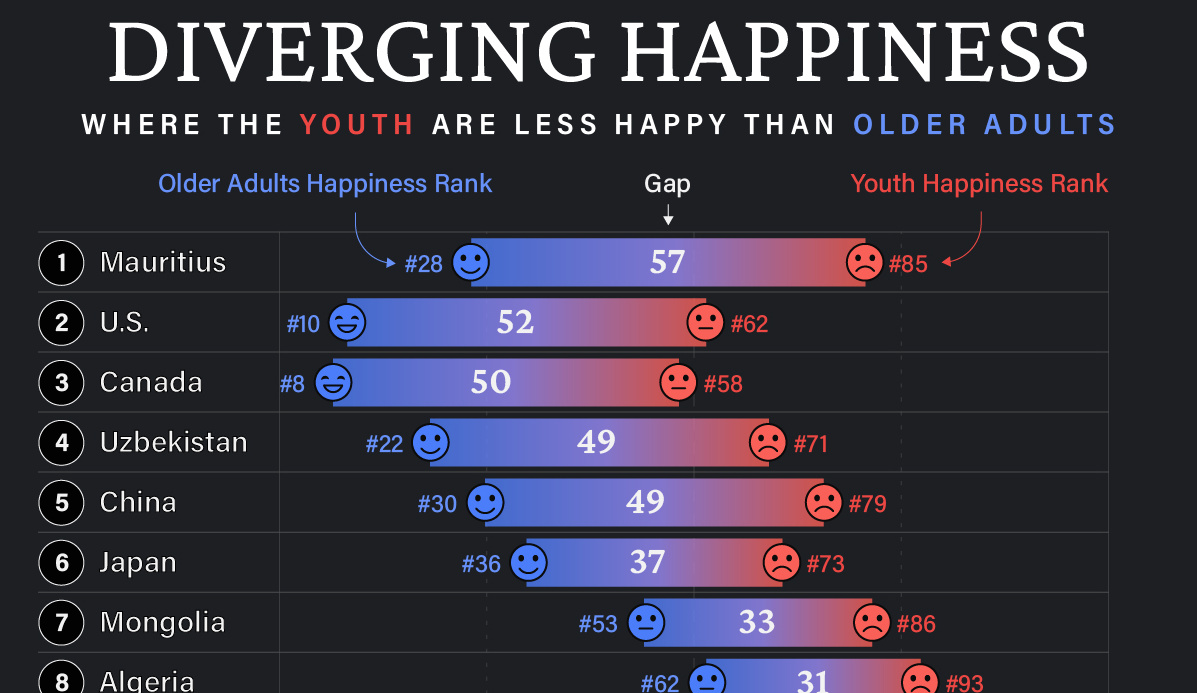
Countries with the Biggest Happiness Gaps Between Generations
This was originally posted on our Voronoi app. Download the app for free on iOS or Android and discover incredible data-driven charts from a variety of trusted sources.
“They say a person needs just three things to be truly happy in this world: someone to love, something to do, and something to hope for.” — Tom Bodett
Measuring happiness is tricky business, more so when taking into account how different regions, cultures, and faiths define it. Nevertheless, the World Happiness Report attempts to distill being happy into a single score out of 10, and then ranks countries by their average score.
We’ve visualized the high-level findings from the latest happiness report in this series of maps. However, the report also dives deeper into other significant trends in the data, such as a growing disparity in happiness between age groups within countries themselves.
In the chart above, we list countries by the biggest gaps in happiness ranks between young adults (<30) and older adults (60+). A higher number indicates a larger gap, and that the youth are far unhappier than their older counterparts.
Where are Youth Unhappier than Older Adults?
Mauritius ranks first on this list, with a massive 57 place gap between older adult and youth happiness. The 1.26 million-inhabited island nation briefly reached high income status in 2020, but the pandemic hit hard, hurting its key tourism sector, and affecting jobs.
The country’s youth unemployment rate spiked to close to 25% that year, but has since been on the decline. Like residents on many similarly-populated islands, the younger demographic often moves abroad in search of more opportunities.
| Rank | Country | Youth Happiness Rank | Older Adult Happiness Rank | Happiness Gap |
|---|---|---|---|---|
| 1 | 🇲🇺 Mauritius | 85 | 28 | 57 |
| 2 | 🇺🇸 U.S. | 62 | 10 | 52 |
| 3 | 🇨🇦 Canada | 58 | 8 | 50 |
| 4 | 🇺🇿 Uzbekistan | 71 | 22 | 49 |
| 5 | 🇨🇳 China | 79 | 30 | 49 |
| 6 | 🇯🇵 Japan | 73 | 36 | 37 |
| 7 | 🇲🇳 Mongolia | 86 | 53 | 33 |
| 8 | 🇩🇿 Algeria | 93 | 62 | 31 |
| 9 | 🇱🇾 Libya | 80 | 50 | 30 |
| 10 | 🇸🇬 Singapore | 54 | 26 | 28 |
| 11 | 🇰🇿 Kazakhstan | 69 | 42 | 27 |
| 12 | 🇵🇭 Philippines | 70 | 43 | 27 |
| 13 | 🇱🇦 Laos | 104 | 77 | 27 |
| 14 | 🇩🇪 Germany | 47 | 21 | 26 |
| 15 | 🇪🇸 Spain | 55 | 29 | 26 |
| 16 | 🇲🇹 Malta | 57 | 31 | 26 |
| 17 | 🇧🇭 Bahrain | 77 | 51 | 26 |
| 18 | 🇰🇬 Kyrgyzstan | 81 | 55 | 26 |
| 19 | 🇲🇷 Mauritania | 119 | 93 | 26 |
| 20 | 🇹🇩 Chad | 120 | 94 | 26 |
Conventional wisdom says, and data somewhat correlates, that young adults (those below 30) tend to be the happiest demographic. Happiness then decreases through middle age and starts increasing around 60. However, the above countries are digressing from the pattern, with older generations being much happier than young adults.
That older generations are happier, by itself, is not a bad thing. However, that younger adults are so much unhappier in the same country can point to several unique stresses that those aged below 30 are facing.
For example, in the U.S. and Canada—both near the top of this list—many young adults feel like they have been priced out of owning a home: a once key metric of success.
Climate anxieties are also high, with worries about the future of the world they’ll inhabit. Finally, persistent economic inequities are also weighing on the younger generation, with many in that cohort feeling like they will never be able to afford to retire.
All of this comes alongside a rising loneliness epidemic, where those aged 18–25 report much higher rates of loneliness than the general population.
Source: The World Happiness Report which leverages data from the Gallup World Poll.
Methodology: A nationally representative group of approximately 1,000 people per country are asked to evaluate their life on a scale of 0–10. Scores are averaged across generations per country over three years. Countries are ranked by their scores out of 10.

-

 Maps7 days ago
Map: Where Are America’s Largest Landfills?
-

 Finance2 weeks ago
Ranked: The World’s 50 Largest Private Equity Firms
-

 Maps2 weeks ago
Mapped: The 10 U.S. States With the Lowest Real GDP Growth
-

 China2 weeks ago
Comparing New and Current U.S. Tariffs on Chinese Imports
-

 Politics2 weeks ago
Which Countries Have the Most Economic Influence in Southeast Asia?
-

 Misc2 weeks ago
The Top 25 Nationalities of U.S. Immigrants
-

 Demographics2 weeks ago
Ranked: Countries Where Youth are the Most Unhappy, Relative to Older Generations
-

 Technology2 weeks ago
Visualizing the 5 Most Common Cybersecurity Mistakes