Misc
Animated Map: Visualizing Earth’s Seasons
Article/Editing:
Animated Map: Visualizing Earth’s Seasons
Why does Earth have seasons?
Many people think the seasons are dictated by Earth’s proximity to the Sun, but this isn’t the case. It’s the Earth’s tilt, not its closeness to the Sun, that influences our seasons.
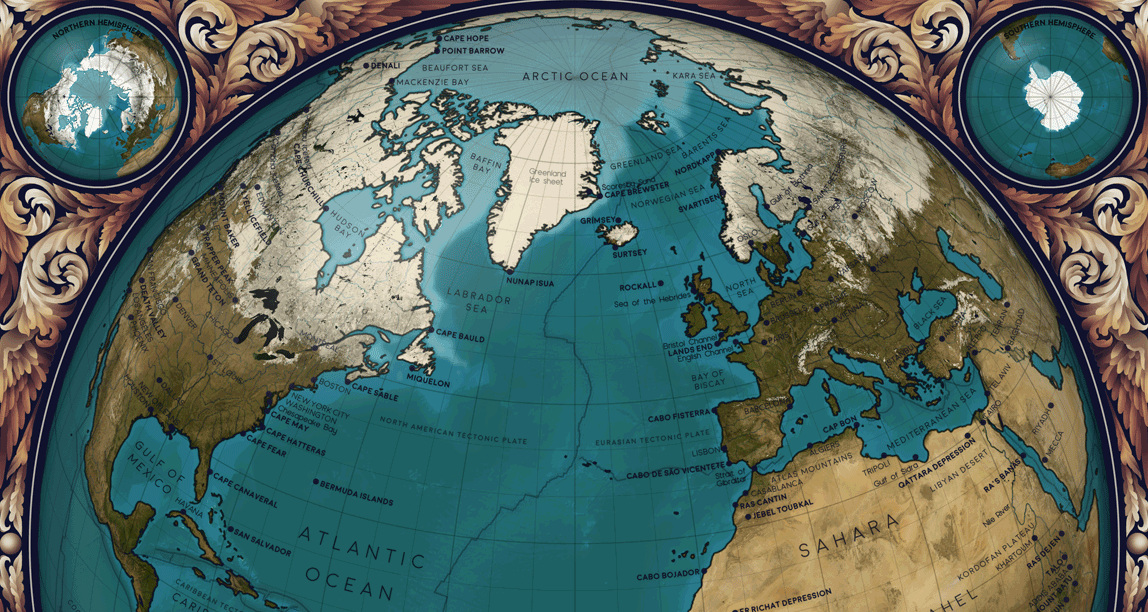
This animated map by Eleanor Lutz visualizes Earth’s seasons, showing how the temperature changes impact ice levels in the Arctic as well as vegetation more broadly. It also highlights the cloud cover and sunlight each hemisphere receives throughout the year, with each frame in the animation representing a month of time.
Why is Earth Tilted?
Unlike some of the planets that sit completely upright and rotate perpendicularly, Earth rotates on a 23.5-degree axis.
But why? A commonly accepted theory among the scientific community is the giant impact hypothesis. According to this theory, a celestial object called Theia collided with Earth many years ago, when the planet was still forming. This collision not only knocked Earth into its tilted position—some believe that the dust and debris from this impact ended up forming our moon.
Ever since, our planet has been rotating with a slight tilt (which itself is not fixed, as it “wobbles” in cycles), giving us our varying seasons throughout the year.
How Earth’s Tilt Influences our Seasons
As our planet orbits the Sun, it’s always leaning in the same direction. Because of its tilt, the different hemispheres receive varying amounts of sunlight at different times of the year.
In December, Earth is technically closer to the Sun than it is in June or July. However, because the Northern Hemisphere is tilted away from the Sun during December, that part of the planet experiences winter during that time.
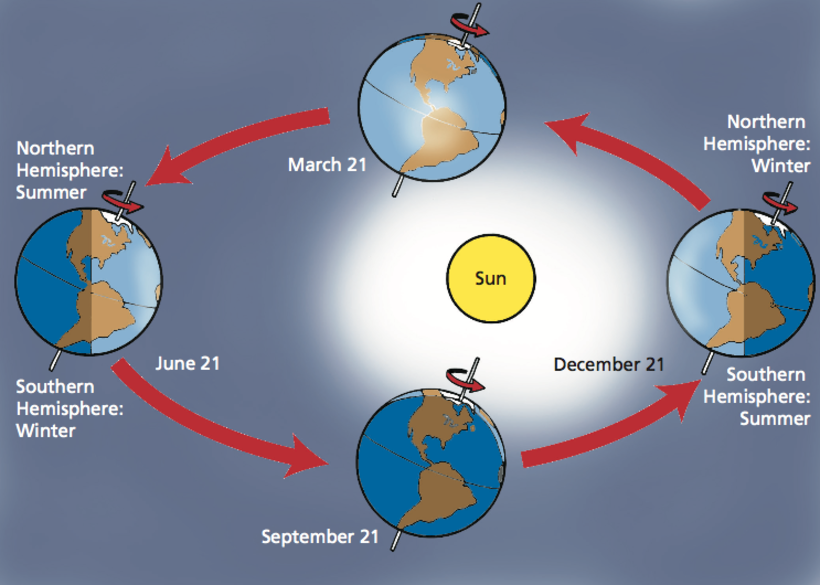
The graphic above by the Smithsonian Science Education Center (SSEC) visualizes Earth’s orbit throughout the year, showing when each hemisphere receives the most direct sunlight (and thus, experiences summer).
The Climate Change Impact
While our seasons have always varied, it’s worth noting that climate change has impacted our seasons, and changed how much Arctic ice we lose each summer.
In the past, millions of miles of ice remained frozen throughout the summer months. In the 1980s, there were 3.8 million square miles of ice in July—that’s roughly the same size as Australia.
Over the years, Arctic ice cover has steadily declined. In July 2020, the ice cover was only 2.8 million square miles—a million less than the amount four decades ago.
Some scientists are predicting that we could lose our summer sea ice entirely by 2035, which would have a devastating impact on the Artic’s wildlife and the indigenous people who live there.

This article was published as a part of Visual Capitalist's Creator Program, which features data-driven visuals from some of our favorite Creators around the world.


Mapped: The World’s Largest Armies in 2024
This was originally posted on our Voronoi app. Download the app for free on iOS or Android and discover incredible data-driven charts from a variety of trusted sources.
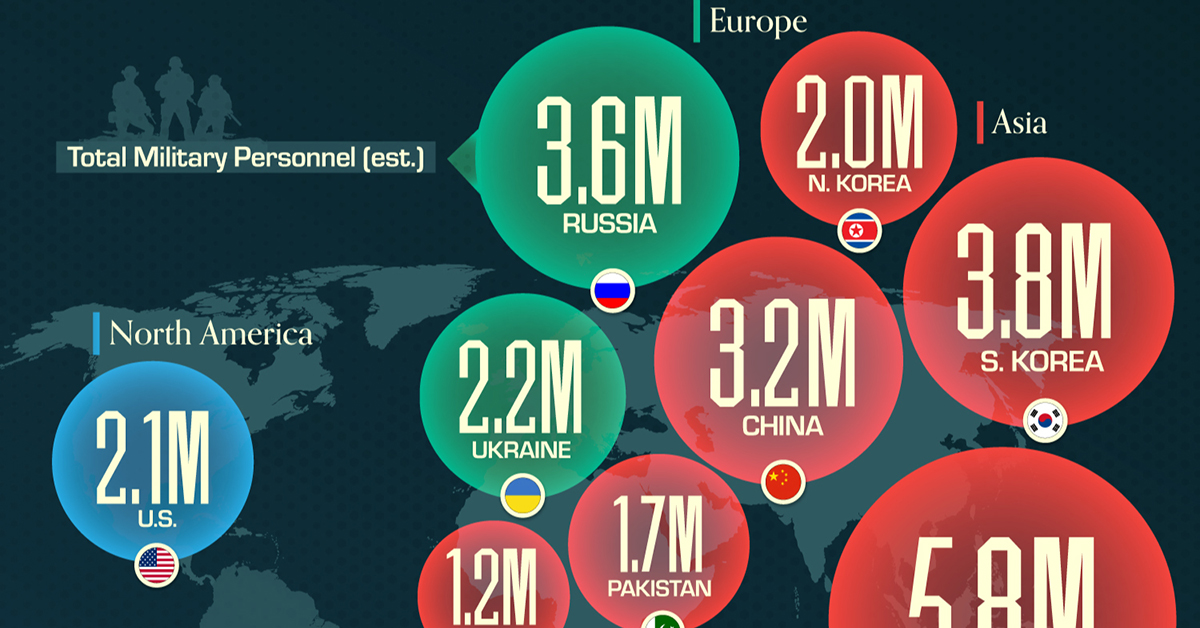
Despite being considered the biggest military force in the world, the United States doesn’t have the largest army in terms of personnel.
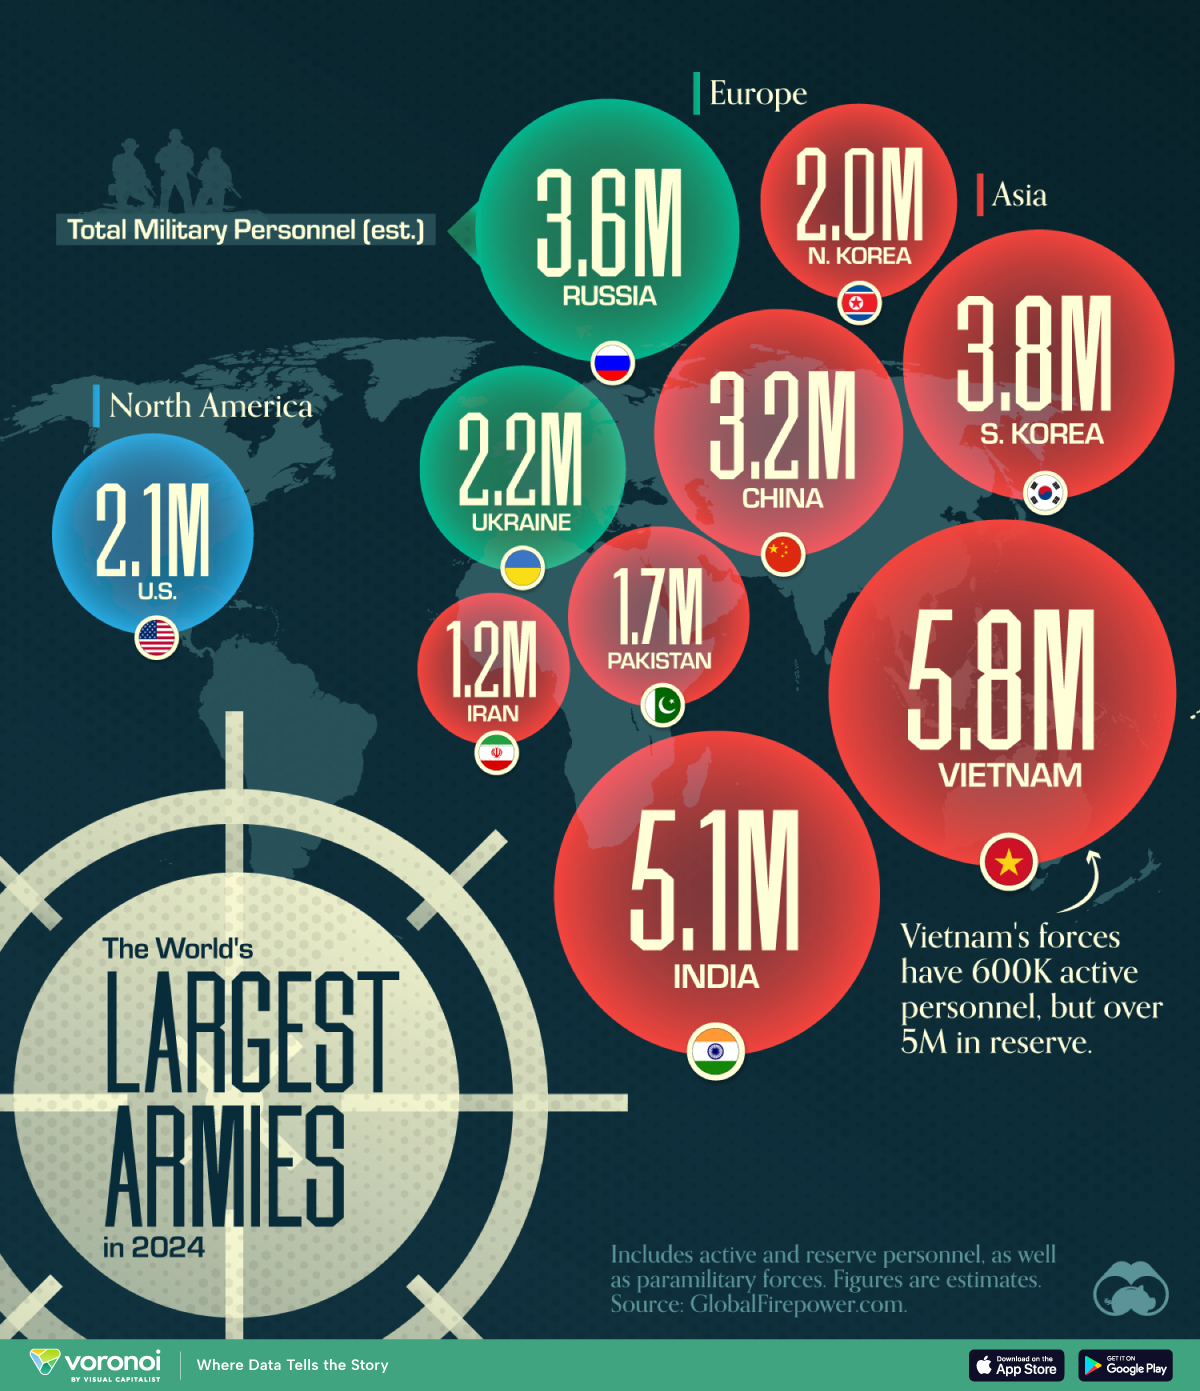
This graphic shows the top 10 countries by military personnel as of May 2024, including active and reserve personnel, as well as paramilitary forces. It is based on estimates from GlobalFirepower.com.
Vietnam, India, and South Korea Have the Biggest Armies
China has the largest standing army, with over 2 million active personnel. With increasing defense spending over the last decades, the country also ranks third in the number of tanks and second in the number of aircraft carriers in service.
When reserve personnel are included, however, the Chinese military falls behind those of Vietnam, India, South Korea, and Russia.
Vietnam’s forces include 600,000 active personnel and over 5 million in reserve. This is because Vietnam, along with countries like South Korea and Israel, has a standing policy of conscription for young adults.
| Country | Total Military Personnel (est.) | Region |
|---|---|---|
| 🇻🇳 Vietnam | 5.8M | Asia |
| 🇮🇳 India | 5.1M | Asia |
| 🇰🇷 South Korea | 3.8M | Asia |
| 🇷🇺 Russia | 3.6M | Europe/Asia |
| 🇨🇳 China | 3.2M | Asia |
| 🇺🇦 Ukraine | 2.2M | Europe |
| 🇺🇸 United States | 2.1M | North America |
| 🇰🇵 North Korea | 2.0M | Asia |
| 🇵🇰 Pakistan | 1.7M | Asia |
| 🇮🇷 Iran | 1.2M | Middle East |
Interestingly, the 2022 Russian invasion of Ukraine resulted in a massive increase in Ukrainian personnel numbers. Active personnel rose from around 170,000 in 2016 to over 900,000.
Despite not having the largest army, the U.S. accounts for almost 40% of global military expenditures, with its 2022 spending totaling $877 billion.
China ranked second in absolute terms, accounting for another 13% of world military expenditure at $292 billion.

-

 Maps7 days ago
Map: Where Are America’s Largest Landfills?
-

 Finance2 weeks ago
Ranked: The World’s 50 Largest Private Equity Firms
-

 Markets2 weeks ago
Mapped: The 10 U.S. States With the Lowest Real GDP Growth
-

 Economy2 weeks ago
Comparing New and Current U.S. Tariffs on Chinese Imports
-

 China2 weeks ago
Which Countries Have the Most Economic Influence in Southeast Asia?
-

 United States2 weeks ago
The Top 25 Nationalities of U.S. Immigrants
-

 Countries2 weeks ago
Ranked: Countries Where Youth are the Most Unhappy, Relative to Older Generations
-

 Technology2 weeks ago
Visualizing the 5 Most Common Cybersecurity Mistakes