Personal Finance
Charted: Retirement Age by Country
Charted: Retirement Age by Country
The retirement landscape can look completely different depending on what country you’re in. And charting the retirement age by country reveals a lot of differences in the the makeup of a labor force, both for economic and cultural reasons.
This graphic delves into the current and effective retirement ages across 45 nations in 2020, based on comprehensive data from the OECD 2021 report.
Defining Retirement Ages
Before we dive into the numbers, let’s clarify the measurements used by the Organisation for Economic Co-operation and Development (OECD):
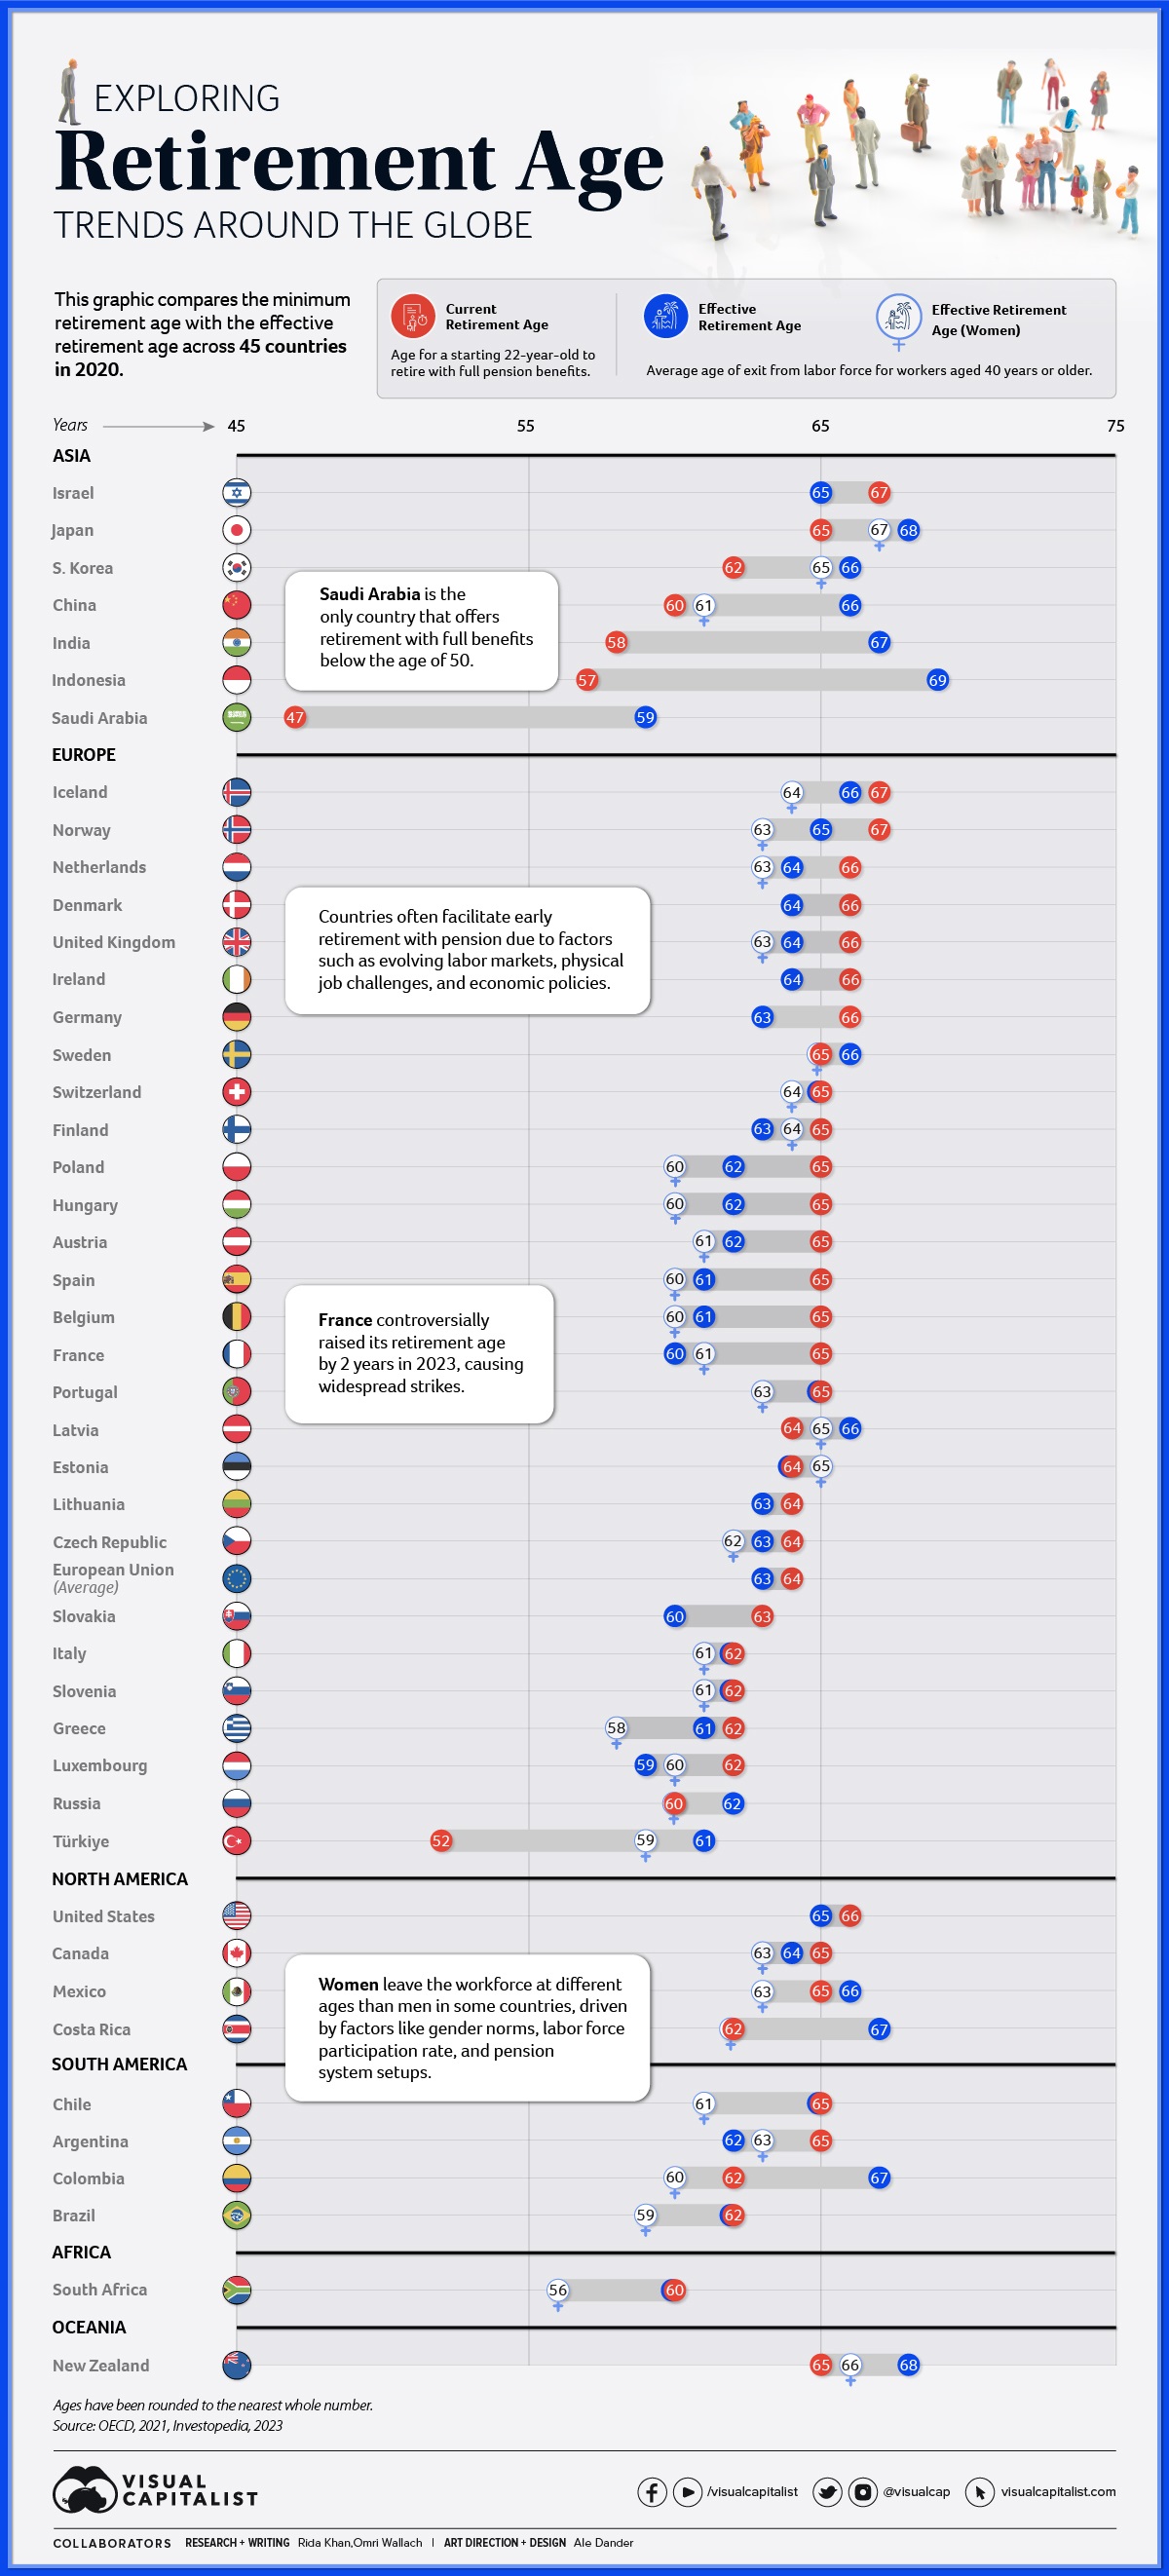
- The current retirement age is the age at which individuals can retire without penalty to pension after completing a full career starting from age 22.
- The effective retirement age refers to the average age of exit from the labor force for workers aged 40 years or more.
Many countries have seen workers effectively retire earlier or later than the current retirement age. This variance can arise due to a multitude in factors including differences in career start ages, some industries offering earlier retirements or benefits for later commitments, or countries facilitating different workforce exits due to market demands and policies.
Some people also choose to retire early due to personal reasons or a lack of available work, receiving a smaller pension or in some cases forgoing it entirely. Likewise, some people choose to stay employed if they are able to find work.
Retirement Age by Country in 2020
Here’s a snapshot of the current and effective retirement ages by country in 2020:
| Country | Retirement age (Current) | Retirement age (Effective) | Retirement age (Women, Effective) |
|---|---|---|---|
| 🇦🇹 Austria | 65 | 62 | 61 |
| 🇧🇪 Belgium | 65 | 61 | 60 |
| 🇨🇦 Canada | 65 | 64 | 63 |
| 🇨🇱 Chile | 65 | 65 | 61 |
| 🇨🇴 Colombia | 62 | 67 | 60 |
| 🇨🇷 Costa Rica | 62 | 67 | 62 |
| 🇨🇿 Czech Republic | 64 | 63 | 62 |
| 🇩🇰 Denmark | 66 | 64 | N/A |
| 🇪🇪 Estonia | 64 | 64 | 65 |
| 🇫🇮 Finland | 65 | 63 | 64 |
| 🇫🇷 France | 65 | 60 | 61 |
| 🇩🇪 Germany | 66 | 63 | N/A |
| 🇬🇷 Greece | 62 | 61 | 58 |
| 🇭🇺 Hungary | 65 | 62 | 60 |
| 🇮🇸 Iceland | 67 | 66 | 64 |
| 🇮🇪 Ireland | 66 | 64 | N/A |
| 🇮🇱 Israel | 67 | 65 | N/A |
| 🇮🇹 Italy | 62 | 62 | 61 |
| 🇯🇵 Japan | 65 | 68 | 67 |
| 🇰🇷 Korea, Republic of | 62 | 66 | 65 |
| 🇱🇻 Latvia | 64 | 66 | 65 |
| 🇱🇹 Lithuania | 64 | 63 | N/A |
| 🇱🇺 Luxembourg | 62 | 59 | 60 |
| 🇲🇽 Mexico | 65 | 66 | 63 |
| 🇳🇱 Netherlands | 66 | 64 | 63 |
| 🇳🇿 New Zealand | 65 | 68 | 66 |
| 🇳🇴 Norway | 67 | 65 | 63 |
| 🇵🇱 Poland | 65 | 62 | 60 |
| 🇵🇹 Portugal | 65 | 65 | 63 |
| 🇸🇰 Slovakia | 63 | 60 | N/A |
| 🇸🇮 Slovenia | 62 | 62 | 61 |
| 🇪🇸 Spain | 65 | 61 | 60 |
| 🇸🇪 Sweden | 65 | 66 | 65 |
| 🇨🇭 Switzerland | 65 | 65 | 64 |
| 🇹🇷 Türkiye | 52 | 61 | 59 |
| 🇬🇧 United Kingdom | 66 | 64 | 63 |
| 🇺🇸 United States | 66 | 65 | N/A |
| 🇪🇺 European Union (Average) | 64 | 63 | N/A |
| 🇦🇷 Argentina | 65 | 62 | 63 |
| 🇧🇷 Brazil | 62 | 62 | 59 |
| 🇨🇳 China (People's Republic of) | 60 | 66 | 61 |
| 🇮🇳 India | 58 | 67 | N/A |
| 🇮🇩 Indonesia | 57 | 69 | N/A |
| 🇷🇺 Russia | 62 | 62 | 60 |
| 🇸🇦 Saudi Arabia | 47 | 59 | N/A |
| 🇿🇦 South Africa | 60 | 60 | 56 |
Three countries had the highest current retirement age at 67 years, Iceland, Israel, and Norway, but all had slightly lower effective retirement ages on average. On the flip side, Saudi Arabia had the lowest current retirement age at only 47 years with full pension benefits. Only Türkiye at 52 years was close, and notably both had much higher effective retirement ages on average.
Discrepancies between different regions are clear across the board. Many Asian countries including China, India, and South Korea have official minimum retirement ages in the early 60s and late 50s, but see workers stay in the workforce well into their late 60s. Meanwhile, most European countries as well as the U.S. and Canada have more workers retire earlier than minimum retirement ages on average.
Almost all of the countries with measured effective retirement ages for women also saw them exit the workforce earlier than men. This can be the result of cultural gender norms, labor force participation rates, and even the setup of pension systems in different countries.
The five exceptions in the dataset where women retired later than men? Argentina, Estonia, Finland, France, and Luxembourg.
Looking to the Future
In 2023, France sparked controversy by raising its early retirement age by two years. This decision triggered widespread strikes and riots and ignited debates about the balance between economic sustainability and individual well-being.
Given aging demographics in many developed countries and a continued need for labor, this isn’t expected to be the only country to reassess retirement. The OECD projects a two-year increase in the average effective retirement age by the mid-2060s.


Personal Finance
Mapped: The Income a Family Needs to Live Comfortably in Every U.S. State
Families in expensive states require over $270,000 annually to live comfortably.
The Income a Family Needs to Live Comfortably in Every U.S. State
This was originally posted on our Voronoi app. Download the app for free on iOS or Android and discover incredible data-driven charts from a variety of trusted sources.
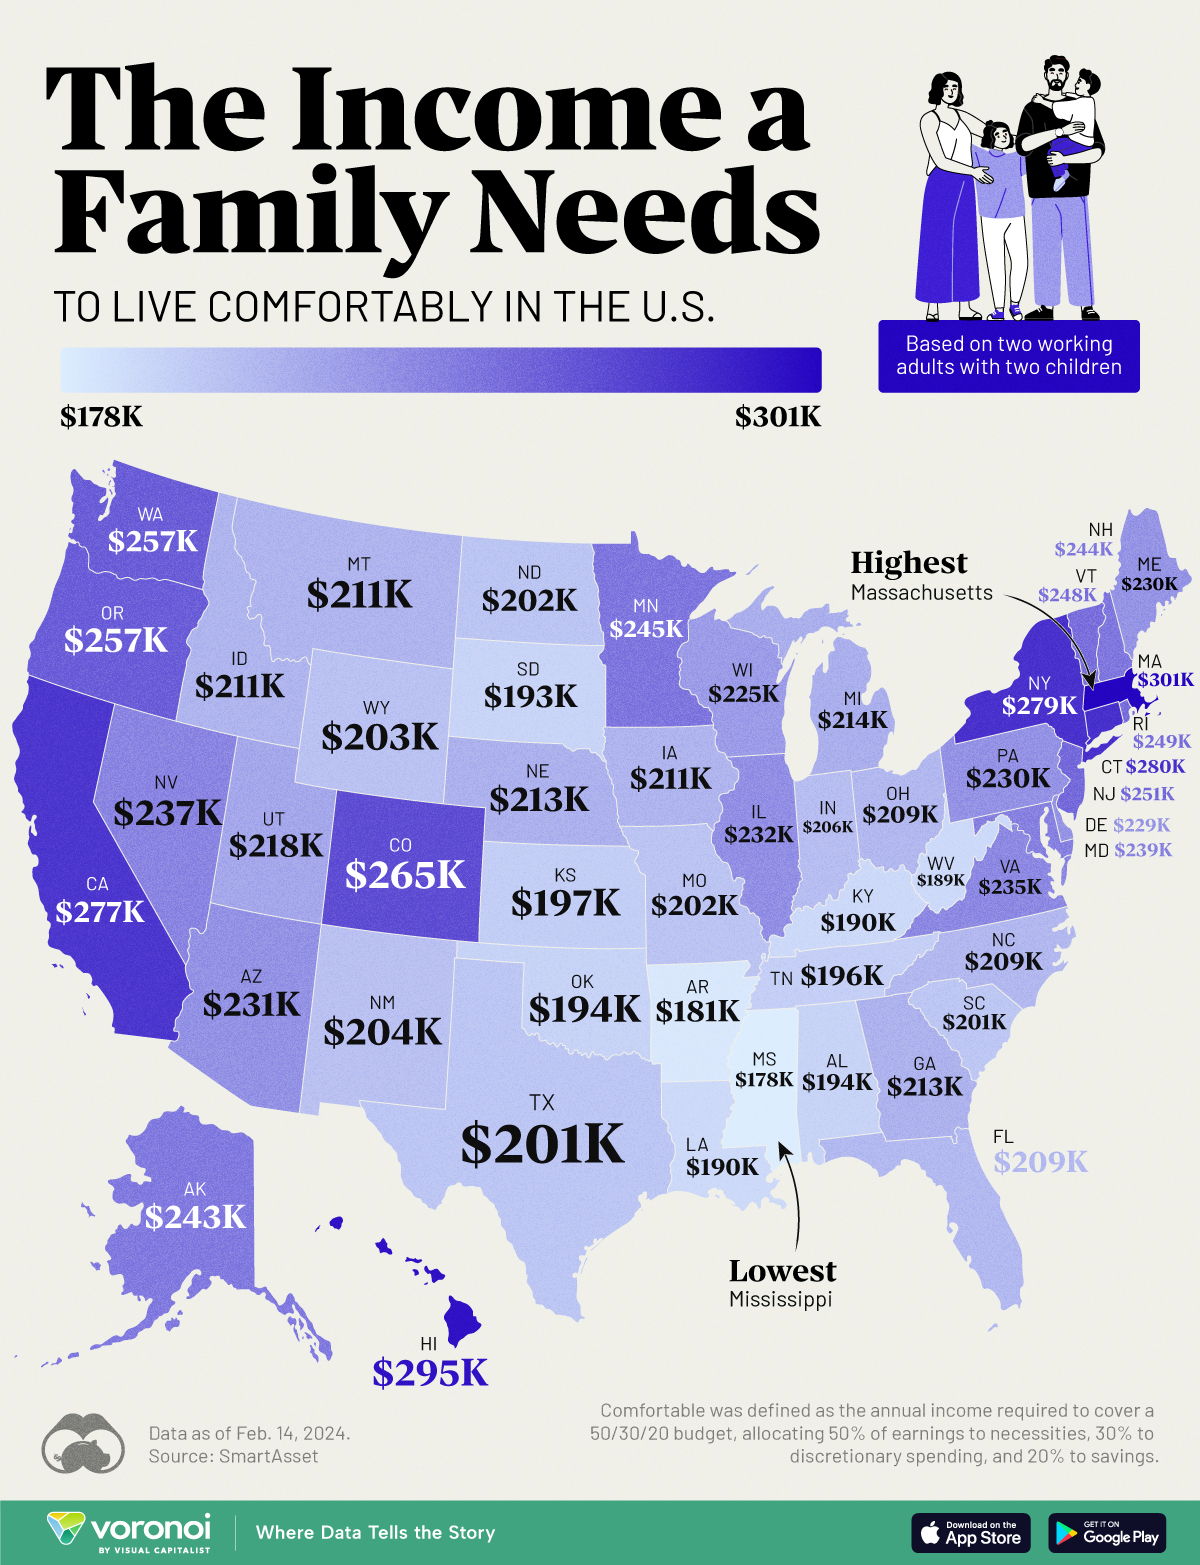
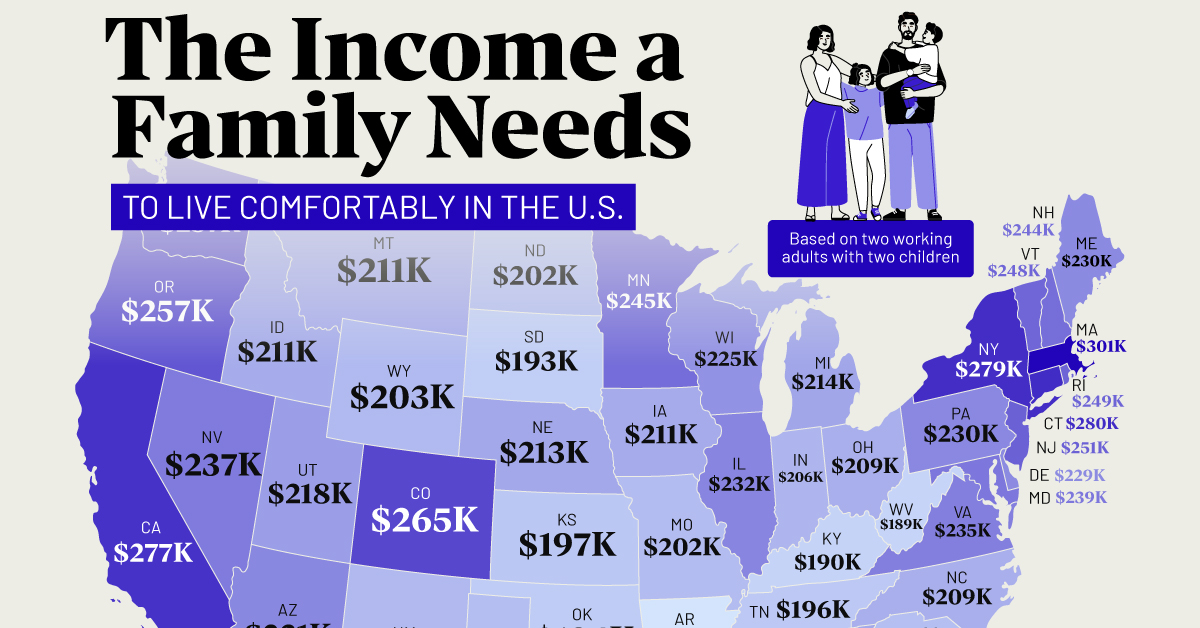
Families in the top five most expensive U.S. states require an annual income exceeding $270,000 to live comfortably.
This visualization illustrates the income necessary for two working adults with two children to maintain a comfortable lifestyle in each state.
“Comfortable” is defined as the income needed to cover a 50/30/20 budget, with 50% allocated to necessities like housing and utilities, 30% to discretionary spending, and 20% to savings or investments.
The calculations for family income needed in each state were done by SmartAsset, using the cost of necessities sourced from the MIT Living Wage Calculator, last updated on Feb. 14, 2024.
Massachusetts Tops the List
Massachusetts is the most expensive state to live comfortably in, requiring a total family income of about $301,184. Hawaii ($294,611) comes in second, followed by Connecticut ($279,885).
Housing is one main reason Massachusetts is an expensive state to live in, particularly in the Boston area. In addition, the state also has a high cost of living, including expenses such as healthcare and utilities.
| Rank | State | Income for 2 working adults raising 2 children |
|---|---|---|
| 1 | Massachusetts | $301,184 |
| 2 | Hawaii | $294,611 |
| 3 | Connecticut | $279,885 |
| 4 | New York | $278,970 |
| 5 | California | $276,723 |
| 6 | Colorado | $264,992 |
| 7 | Washington | $257,421 |
| 8 | Oregon | $257,338 |
| 9 | New Jersey | $251,181 |
| 10 | Rhode Island | $249,267 |
| 11 | Vermont | $248,352 |
| 12 | Minnesota | $244,774 |
| 13 | New Hampshire | $244,109 |
| 14 | Alaska | $242,611 |
| 15 | Maryland | $239,450 |
| 16 | Nevada | $237,286 |
| 17 | Virginia | $235,206 |
| 18 | Illinois | $231,962 |
| 19 | Arizona | $230,630 |
| 20 | Pennsylvania | $230,464 |
| 21 | Maine | $229,549 |
| 22 | Delaware | $228,966 |
| 23 | Wisconsin | $225,056 |
| 24 | Utah | $218,483 |
| 25 | Michigan | $214,490 |
| 26 | Nebraska | $213,075 |
| 27 | Georgia | $212,826 |
| 28 | Montana | $211,411 |
| 28 | Iowa | $211,411 |
| 30 | Idaho | $211,245 |
| 31 | North Carolina | $209,331 |
| 31 | Ohio | $209,331 |
| 33 | Florida | $209,082 |
| 34 | Indiana | $206,003 |
| 35 | New Mexico | $203,923 |
| 36 | Wyoming | $203,424 |
| 37 | Missouri | $202,259 |
| 38 | North Dakota | $202,176 |
| 39 | Texas | $201,344 |
| 40 | South Carolina | $200,762 |
| 41 | Kansas | $196,768 |
| 42 | Tennessee | $195,770 |
| 43 | Oklahoma | $194,106 |
| 44 | Alabama | $193,606 |
| 45 | South Dakota | $192,608 |
| 46 | Kentucky | $190,112 |
| 47 | Louisiana | $189,613 |
| 48 | West Virginia | $189,363 |
| 49 | Arkansas | $180,794 |
| 50 | Mississippi | $177,798 |
Meanwhile, Mississippi is the least expensive state for a family to live comfortably, requiring $177,798 per year. Arkansas ($180,794) comes in second, followed by West Virginia ($189,363). In common, all these states share low prices of housing.
Learn More About Cost of Living From Visual Capitalist
If you enjoyed this post, be sure to check out this graphic, which ranks the median down payment for a house by U.S. state.

-

 Healthcare1 week ago
Visualizing Daily Protein Sources by Region
-

 Globalization2 weeks ago
Mapped: The Top Exports in Asian Countries
-

 Finance2 weeks ago
Ranked: The World’s 50 Largest Private Equity Firms
-

 United States2 weeks ago
Mapped: The 10 U.S. States With the Lowest Real GDP Growth
-

 United States2 weeks ago
Comparing New and Current U.S. Tariffs on Chinese Imports
-

 China2 weeks ago
Which Countries Have the Most Economic Influence in Southeast Asia?
-

 Demographics2 weeks ago
The Top 25 Nationalities of U.S. Immigrants
-

 Countries2 weeks ago
Ranked: Countries Where Youth are the Most Unhappy, Relative to Older Generations