Money
Visualizing the Investments of the Ultra-Wealthy
Visualizing Investments of the Ultra-Wealthy
How do the world’s richest people invest their money?
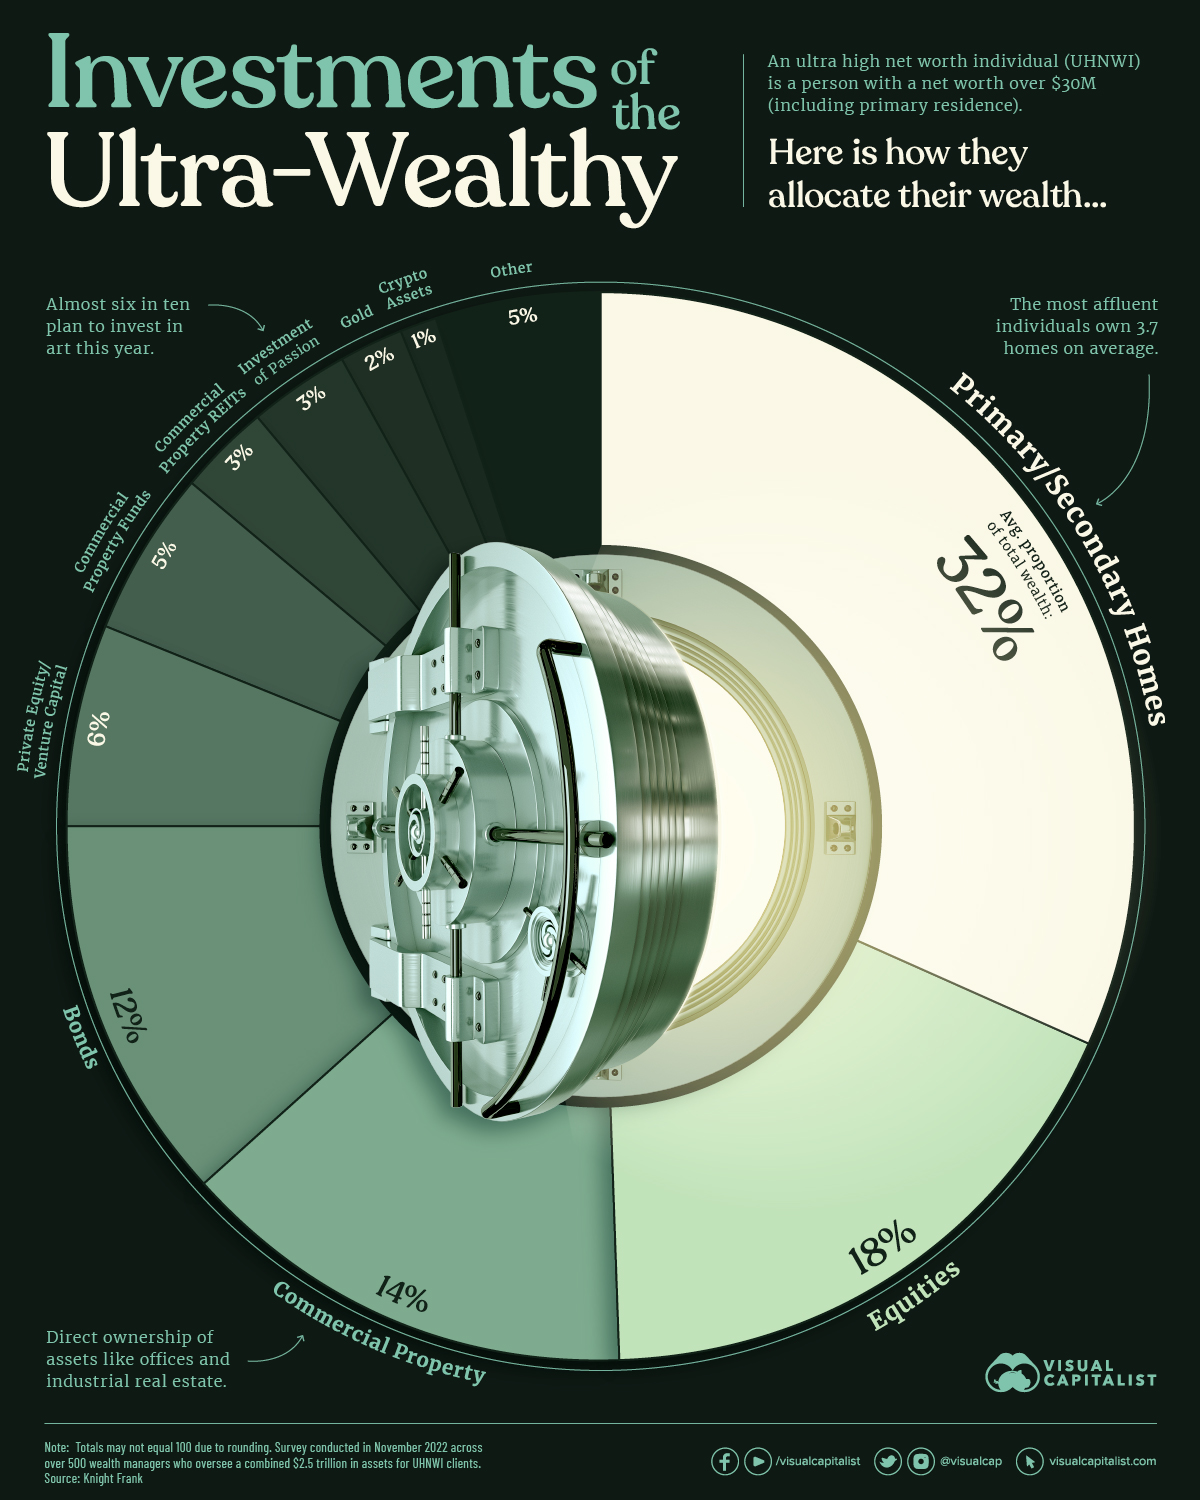
This graphic shows how ultra high net worth individuals (UHNWIs)—people with a net worth of $30 million or more including their primary residence—allocate their wealth based on data from Knight Frank’s 2023 Wealth Report.
How the Ultra-Wealthy Invest
Below, we show where UHNWIs invest their fortunes, based on a global survey of over 500 wealth managers, family offices, and private bankers that oversee a combined $2.5 trillion in assets:
| Rank | Asset | Average Proportion of Total Wealth |
|---|---|---|
| 1 | Primary and Secondary Homes | 32% |
| 2 | Equities | 18% |
| 3 | Commercial Property | 14% |
| 4 | Bonds | 12% |
| 5 | Private Equity / Venture Capital | 6% |
| 6 | Commercial Property Funds | 5% |
| 7 | Commercial Property REITs | 3% |
| 8 | Investment of Passion (e.g. art, cars, wine) | 3% |
| 9 | Gold | 2% |
| 10 | Crypto Assets | 1% |
| 11 | Other | 5% |
Numbers may not total 100 due to rounding.
As the table above shows, primary and secondary homes make up 32% of total wealth, the largest share across assets. The average UHNWI owns 3.7 homes.
Investments in stocks comprised almost 20% of UHNWI wealth, with those in the Americas having the highest share of wealth in equities (33%) followed by Europe (28%) and Asia (26%).
Private equity and venture capital investments, which include investments in startup companies that have not yet gone public, accounted for 6% of total wealth on average. A separate report shows that the average investment in a private equity company ranges between $1.8 million and $6.9 million for UHNWI investors.
Luxury Investments of the Ultra-Rich
Investments of passion, which include a range of luxury items from art to classic cars, make up an average 3% of the total wealth of the ultra-rich.
In 2023, nearly six in 10 UHNWIs said they plan to purchase art.
| Likely to Purchase in 2023 | Global Average |
|---|---|
| Art | 59% |
| Watches | 46% |
| Wine | 39% |
| Classic Cars | 34% |
| Jewelry | 33% |
| Luxury Handbags | 20% |
| Rare Whiskey Bottles | 18% |
| Furniture | 14% |
| Colored Diamonds | 9% |
| Coins | 8% |
Many of these items retain their value over time. In fact, all 10 of these items increased in value over 2022 despite a challenging economic environment which saw the S&P 500 fall over 19%.
The art market saw prices increase 29% last year, the highest across luxury items. Luxury cars (25%) and watches (18%) also saw some of the highest price increases.
The Growth of the Uber-Affluent
In 2022, there were roughly 579,000 people globally with wealth that exceeded $30 million. New York, Tokyo, and San Francisco are home to the most ultra-rich individuals worldwide. Over the next five years, this number is projected to reach 744,000—a 29% increase.
As these numbers continue to climb, demand for luxury real estate, equity investments, and luxury items will likely grow given the investment patterns of the ultra-wealthy illustrated today.


Personal Finance
Mapped: The Income a Family Needs to Live Comfortably in Every U.S. State
Families in expensive states require over $270,000 annually to live comfortably.
The Income a Family Needs to Live Comfortably in Every U.S. State
This was originally posted on our Voronoi app. Download the app for free on iOS or Android and discover incredible data-driven charts from a variety of trusted sources.
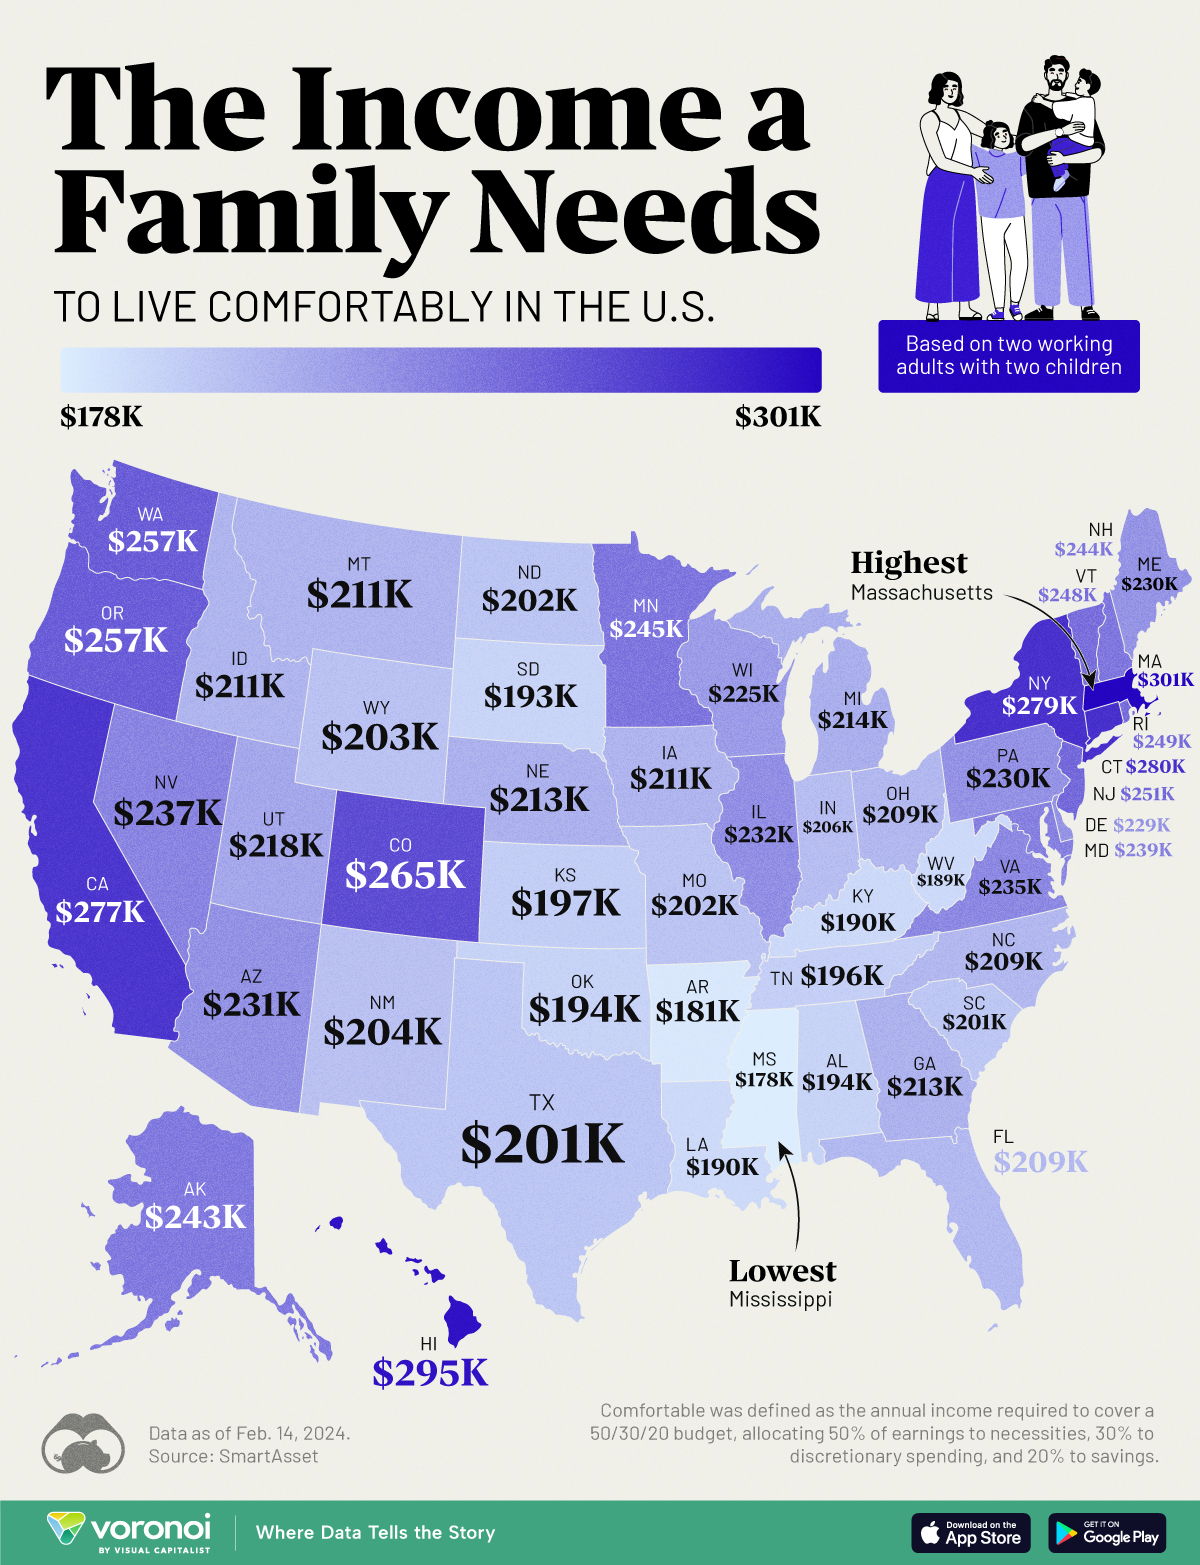
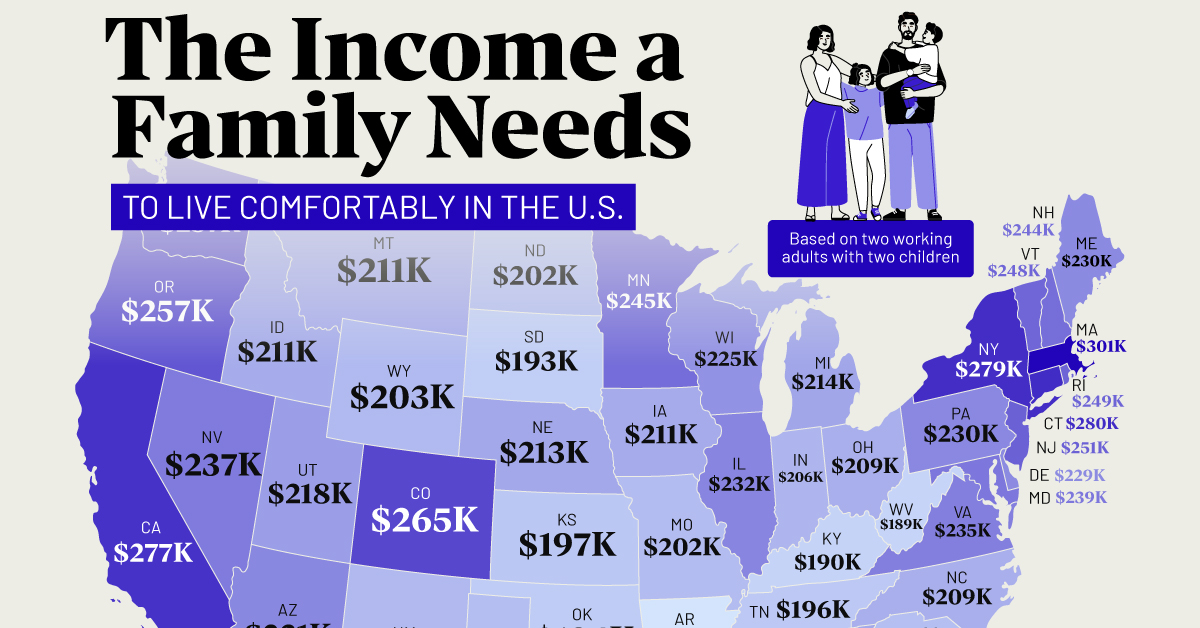
Families in the top five most expensive U.S. states require an annual income exceeding $270,000 to live comfortably.
This visualization illustrates the income necessary for two working adults with two children to maintain a comfortable lifestyle in each state.
“Comfortable” is defined as the income needed to cover a 50/30/20 budget, with 50% allocated to necessities like housing and utilities, 30% to discretionary spending, and 20% to savings or investments.
The calculations for family income needed in each state were done by SmartAsset, using the cost of necessities sourced from the MIT Living Wage Calculator, last updated on Feb. 14, 2024.
Massachusetts Tops the List
Massachusetts is the most expensive state to live comfortably in, requiring a total family income of about $301,184. Hawaii ($294,611) comes in second, followed by Connecticut ($279,885).
Housing is one main reason Massachusetts is an expensive state to live in, particularly in the Boston area. In addition, the state also has a high cost of living, including expenses such as healthcare and utilities.
| Rank | State | Income for 2 working adults raising 2 children |
|---|---|---|
| 1 | Massachusetts | $301,184 |
| 2 | Hawaii | $294,611 |
| 3 | Connecticut | $279,885 |
| 4 | New York | $278,970 |
| 5 | California | $276,723 |
| 6 | Colorado | $264,992 |
| 7 | Washington | $257,421 |
| 8 | Oregon | $257,338 |
| 9 | New Jersey | $251,181 |
| 10 | Rhode Island | $249,267 |
| 11 | Vermont | $248,352 |
| 12 | Minnesota | $244,774 |
| 13 | New Hampshire | $244,109 |
| 14 | Alaska | $242,611 |
| 15 | Maryland | $239,450 |
| 16 | Nevada | $237,286 |
| 17 | Virginia | $235,206 |
| 18 | Illinois | $231,962 |
| 19 | Arizona | $230,630 |
| 20 | Pennsylvania | $230,464 |
| 21 | Maine | $229,549 |
| 22 | Delaware | $228,966 |
| 23 | Wisconsin | $225,056 |
| 24 | Utah | $218,483 |
| 25 | Michigan | $214,490 |
| 26 | Nebraska | $213,075 |
| 27 | Georgia | $212,826 |
| 28 | Montana | $211,411 |
| 28 | Iowa | $211,411 |
| 30 | Idaho | $211,245 |
| 31 | North Carolina | $209,331 |
| 31 | Ohio | $209,331 |
| 33 | Florida | $209,082 |
| 34 | Indiana | $206,003 |
| 35 | New Mexico | $203,923 |
| 36 | Wyoming | $203,424 |
| 37 | Missouri | $202,259 |
| 38 | North Dakota | $202,176 |
| 39 | Texas | $201,344 |
| 40 | South Carolina | $200,762 |
| 41 | Kansas | $196,768 |
| 42 | Tennessee | $195,770 |
| 43 | Oklahoma | $194,106 |
| 44 | Alabama | $193,606 |
| 45 | South Dakota | $192,608 |
| 46 | Kentucky | $190,112 |
| 47 | Louisiana | $189,613 |
| 48 | West Virginia | $189,363 |
| 49 | Arkansas | $180,794 |
| 50 | Mississippi | $177,798 |
Meanwhile, Mississippi is the least expensive state for a family to live comfortably, requiring $177,798 per year. Arkansas ($180,794) comes in second, followed by West Virginia ($189,363). In common, all these states share low prices of housing.
Learn More About Cost of Living From Visual Capitalist
If you enjoyed this post, be sure to check out this graphic, which ranks the median down payment for a house by U.S. state.

-
 Healthcare1 week ago
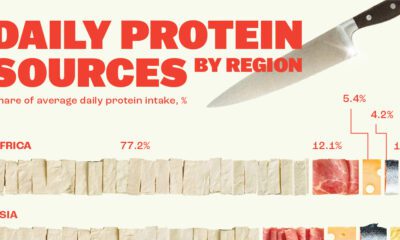
Visualizing Daily Protein Sources by Region
-

 Globalization2 weeks ago
Mapped: The Top Exports in Asian Countries
-

 Finance2 weeks ago
Ranked: The World’s 50 Largest Private Equity Firms
-

 United States2 weeks ago
Mapped: The 10 U.S. States With the Lowest Real GDP Growth
-

 United States2 weeks ago
Comparing New and Current U.S. Tariffs on Chinese Imports
-

 China2 weeks ago
Which Countries Have the Most Economic Influence in Southeast Asia?
-

 Demographics2 weeks ago
The Top 25 Nationalities of U.S. Immigrants
-

 Countries2 weeks ago
Ranked: Countries Where Youth are the Most Unhappy, Relative to Older Generations