Green
Ranked: The Foods With the Largest Environmental Impact


The Environmental Impacts of Food Production
Food and agriculture have a significant impact on our planet, particularly in terms of carbon emissions, water withdrawals, and land use.
To visualize how different food items contribute to this environmental impact, the above graphic ranks foods based on their greenhouse gas (GHG) emissions and water withdrawals, using data from Poore and Nemecek and Our World in Data.
The Carbon Giants
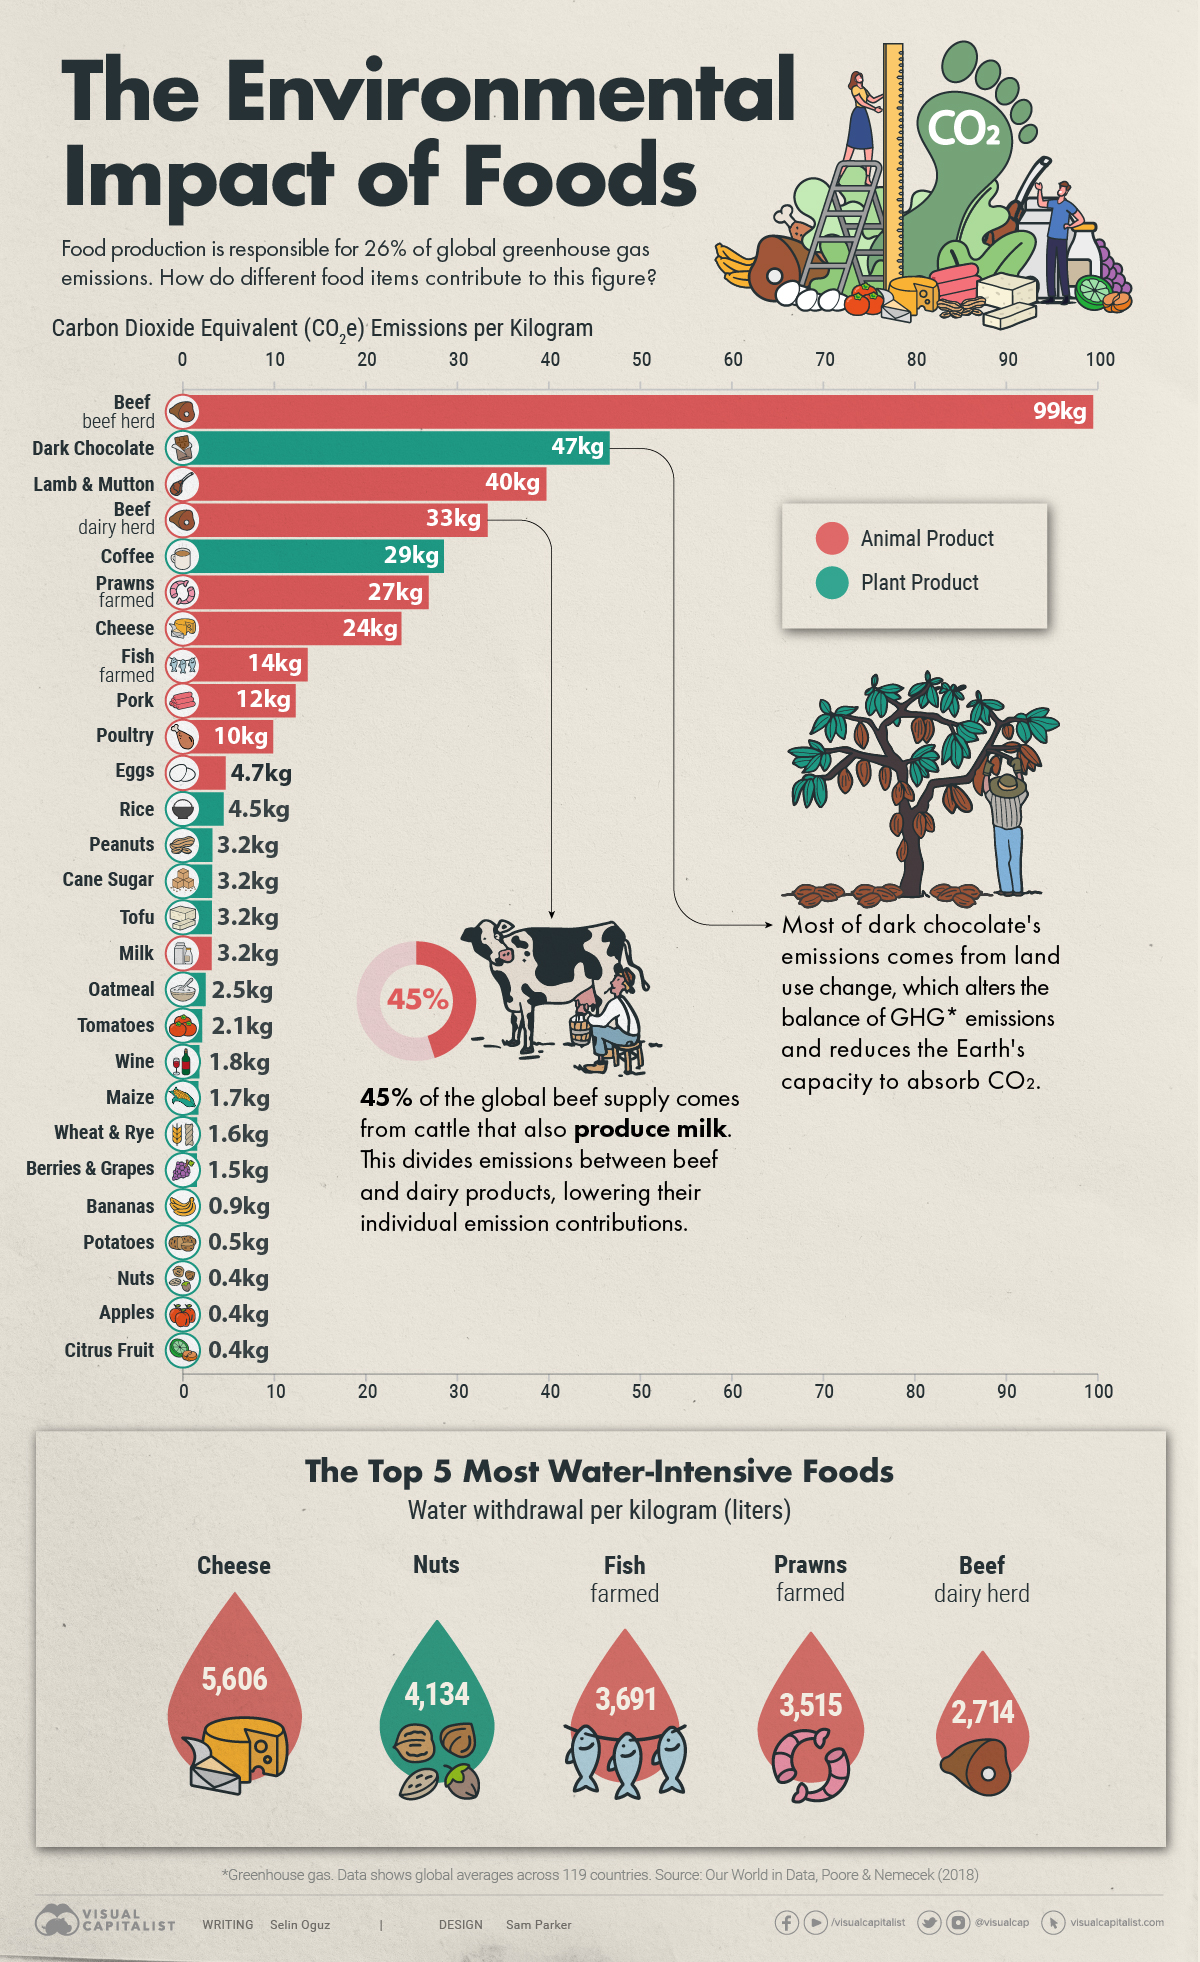
Based on carbon dioxide equivalent (CO2e) measurements, beef comes in first place as the food with the largest carbon footprint, emitting an astounding 99 kilograms of CO2e per kilogram of the final meat product.
CO2e emissions are a standardized measure that express the warming impact of various greenhouse gases—such as methane and nitrous oxide—in terms of the amount of CO2 that would have the same warming effect.
The production of beef is extremely resource-intensive, demanding substantial land, water, and energy resources. Cows also produce methane during their digestive processes, a gas that has a warming potential 27–30 times higher than that of CO2 over a 100-year time period.
| Food item | CO2e emissions per kilogram |
|---|---|
| Beef (beef herd) | 99.48 kg |
| Dark Chocolate | 46.65 kg |
| Lamb & Mutton | 39.72 kg |
| Beef (dairy herd) | 33.30 kg |
| Coffee | 28.53 kg |
| Prawns (farmed) | 26.87 kg |
| Cheese | 23.88 kg |
| Fish (farmed) | 13.63 kg |
| Pork | 12.31 kg |
| Poultry | 9.87 kg |
| Eggs | 4.67 kg |
| Rice | 4.45 kg |
| Peanuts | 3.23 kg |
| Cane Sugar | 3.20 kg |
| Tofu | 3.16 kg |
| Milk | 3.15 kg |
| Oatmeal | 2.48 kg |
| Tomatoes | 2.09 kg |
| Wine | 1.79 kg |
| Maize | 1.70 kg |
| Wheat & Rye | 1.57 kg |
| Berries & Grapes | 1.53 kg |
| Bananas | 0.86 kg |
| Potatoes | 0.46 kg |
| Apples | 0.43 kg |
| Nuts | 0.43 kg |
| Root Vegetables | 0.43 kg |
| Citrus Fruit | 0.39 kg |
Following beef on the list is dark chocolate, albeit not very closely.
Most of dark chocolate’s emissions come from land use changes—such as deforestation— which alters the balance of GHG emissions and reduces the Earth’s capacity to absorb CO2.
All in all, however, the data shows us that animal products are generally more emission-intensive than plant-based foods.
Water Use in Food Production
The Food and Agriculture Organization (FAO) states that more than two-thirds of the world’s freshwater withdrawals are used for food production.
Interestingly, the trend that we saw when considering the carbon footprints of foods also applies when it comes to water use. Among the top 10 most water-intensive foods in the world, 70% are of animal origin, highlighting that animal products aren’t only more carbon-intensive but also more water-intensive than plant products.
| Food item | Water withdrawal per kilogram |
|---|---|
| Cheese | 5,605 liters |
| Nuts | 4,134 liters |
| Fish (farmed) | 3,691 liters |
| Prawns (farmed) | 3,515 liters |
| Beef (dairy herd) | 2,714 liters |
| Rice | 2,248 liters |
| Peanuts | 1,852 liters |
| Lamb & Mutton | 1,803 liters |
| Pork | 1,796 liters |
| Beef (beef herd) | 1,451 liters |
Peanuts, rice, and nuts (which include hard-shelled fruits such as hazelnuts, chestnuts, and walnuts) make up the plant-based outliers in the list.
Making More Sustainable Food Choices
Eating locally sourced foods is often posed as a solution for lowering our ecological impact, leading to the growing popularity of concepts such as “The 100 Mile Diet.”
An analysis done by Our World in Data, however, shows us that what we eat makes more of a difference in lowering our environmental footprints than where our food comes from.
More specifically, the data highlights that transportation accounts for just 5% of global food emissions. Land use change and farming activities, on the other hand, account for a much more significant portion.
As such, redirecting our attention from the distance food travels to the emissions associated with its production can yield better outcomes in our efforts to make more sustainable food choices.


Environment
The Rise in America’s Billion-Dollar Extreme Weather Disasters
From tropical cyclones to severe storms, the number of extreme weather disasters with losses exceeding $1 billion has climbed over time.
The Rise in U.S. Billion-Dollar Extreme Weather Disasters
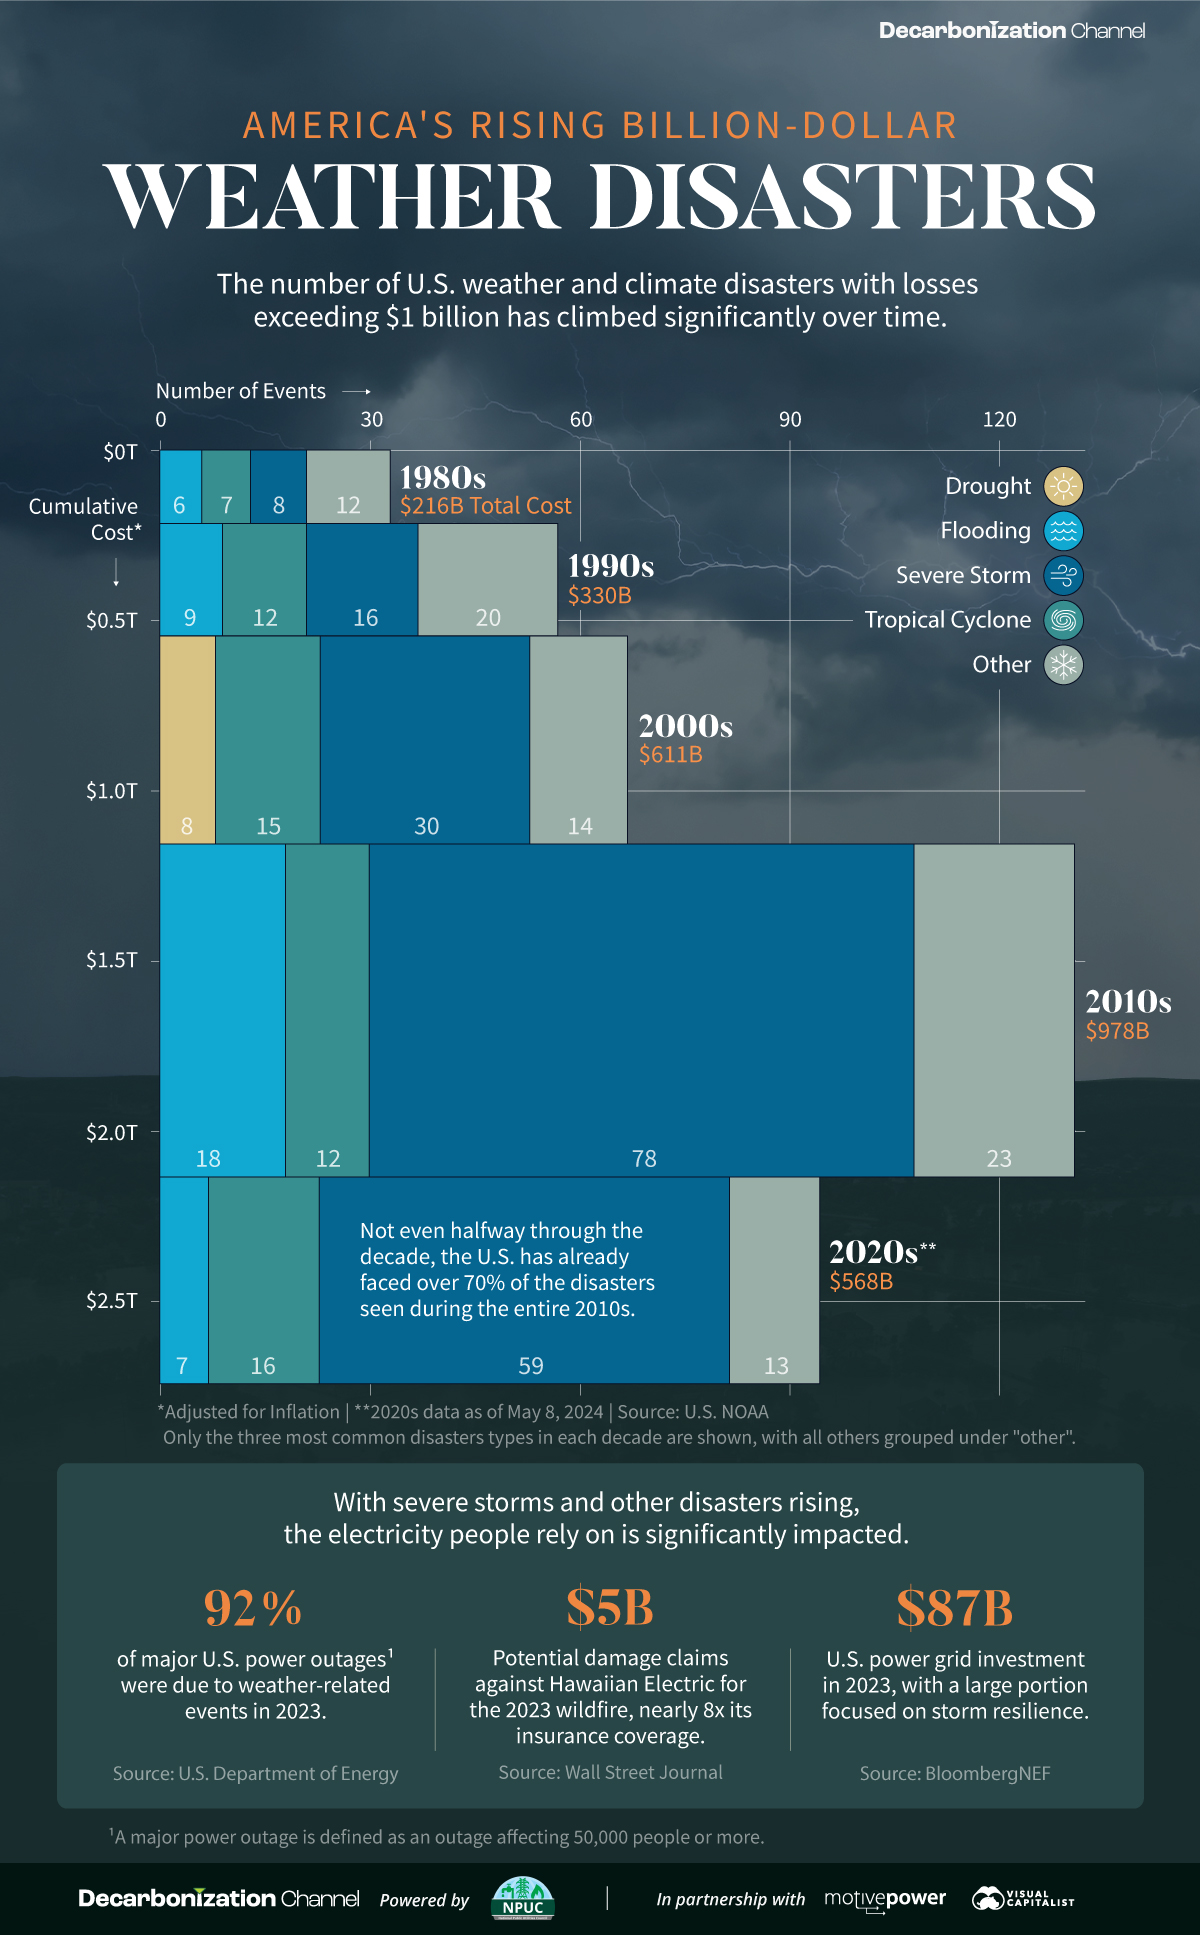
Since 1980, there have been 383 extreme weather or climate disasters where the damages reached at least $1 billion. In total, these disasters have cost more than $2.7 trillion.
Created in partnership with the National Public Utilities Council, this chart shows how these disasters have been increasing with each passing decade.
A Growing Concern
The U.S. National Oceanic and Atmospheric Administration (NOAA) tracks each disaster and estimates the cost based on factors like physical damages and time losses such as business interruption. They adjust all costs by the Consumer Price Index to account for inflation.
| Decade | Total No. of Events | Total Inflation-Adjusted Cost |
|---|---|---|
| 1980s | 33 | $216B |
| 1990s | 57 | $330B |
| 2000s | 67 | $611B |
| 2010s | 131 | $978B |
| 2020s* | 95 | $568B |
* Data is as of May 8, 2024.
Both the number and cost of extreme weather disasters has grown over time. In fact, not even halfway through the 2020s the number of disasters is over 70% of those seen during the entire 2010s.
Severe storms have been the most common, accounting for half of all billion-dollar disasters since 1980. In terms of costs, tropical cyclones have caused the lion’s share—more than 50% of the total. Hurricane Katrina, which made landfall in 2005, remains the most expensive single event with $199 billion in inflation-adjusted costs.
Electricity and Extreme Weather Disasters
With severe storms and other disasters rising, the electricity people rely on is significantly impacted. For instance, droughts have been associated with a decline in hydropower, which is an important source of U.S. renewable electricity generation.
Disasters can also lead to significant costs for utility companies. Hawaii Electric faces $5 billion in potential damages claims for the 2023 wildfire, which is nearly eight times its insurance coverage. Lawsuits accuse the company of negligence in maintaining its infrastructure, such as failing to strengthen power poles to withstand high winds.
Given that the utilities industry is facing the highest risk from extreme weather and climate disasters, some companies have begun to prepare for such events. This means taking steps like burying power lines, increasing insurance coverage, and upgrading infrastructure.
Learn how the National Public Utilities Council is working toward the future of sustainable electricity.

-

 Environment2 months ago
Ranked: Top Countries by Total Forest Loss Since 2001
The country with the most forest loss since 2001 lost as much forest cover as the next four countries combined.
-

 Environment4 months ago
Charted: Share of World Forests by Country
We visualize which countries have the biggest share of world forests by area—and while country size plays a factor, so too, does the environment.
-

 Environment4 months ago
Which Countries Have the Largest Forests?
Together, the top five countries with the largest forests account for more than half of the world’s entire forest cover.
-

 Environment5 months ago
Visualized: What Lives in Your Gut Microbiome?
The human gut microbiome contains a world of microbes. We look at the the bacteria that deeply affect our health and well-being.
-

 Environment6 months ago
Mapped: Global Temperature Rise by Country (2022-2100P)
In this set of three maps, we show the global temperature rise on a national level for 2022, 2050, and 2100 based on an analysis by…
-

 Environment6 months ago
Ranked: Per Capita Carbon Emissions by Country
Which countries rank the highest in per capita carbon emissions, and how do they impact the world’s total carbon emissions?


-
 Healthcare1 week ago
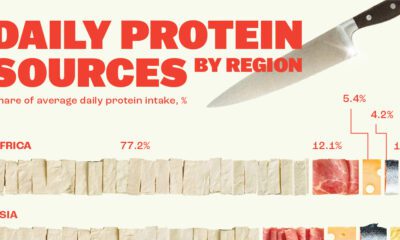
Visualizing Daily Protein Sources by Region
-

 Globalization2 weeks ago
Mapped: The Top Exports in Asian Countries
-

 Finance2 weeks ago
Ranked: The World’s 50 Largest Private Equity Firms
-

 United States2 weeks ago
Mapped: The 10 U.S. States With the Lowest Real GDP Growth
-

 United States2 weeks ago
Comparing New and Current U.S. Tariffs on Chinese Imports
-

 China2 weeks ago
Which Countries Have the Most Economic Influence in Southeast Asia?
-

 Demographics2 weeks ago
The Top 25 Nationalities of U.S. Immigrants
-

 Countries2 weeks ago
Ranked: Countries Where Youth are the Most Unhappy, Relative to Older Generations