Countries
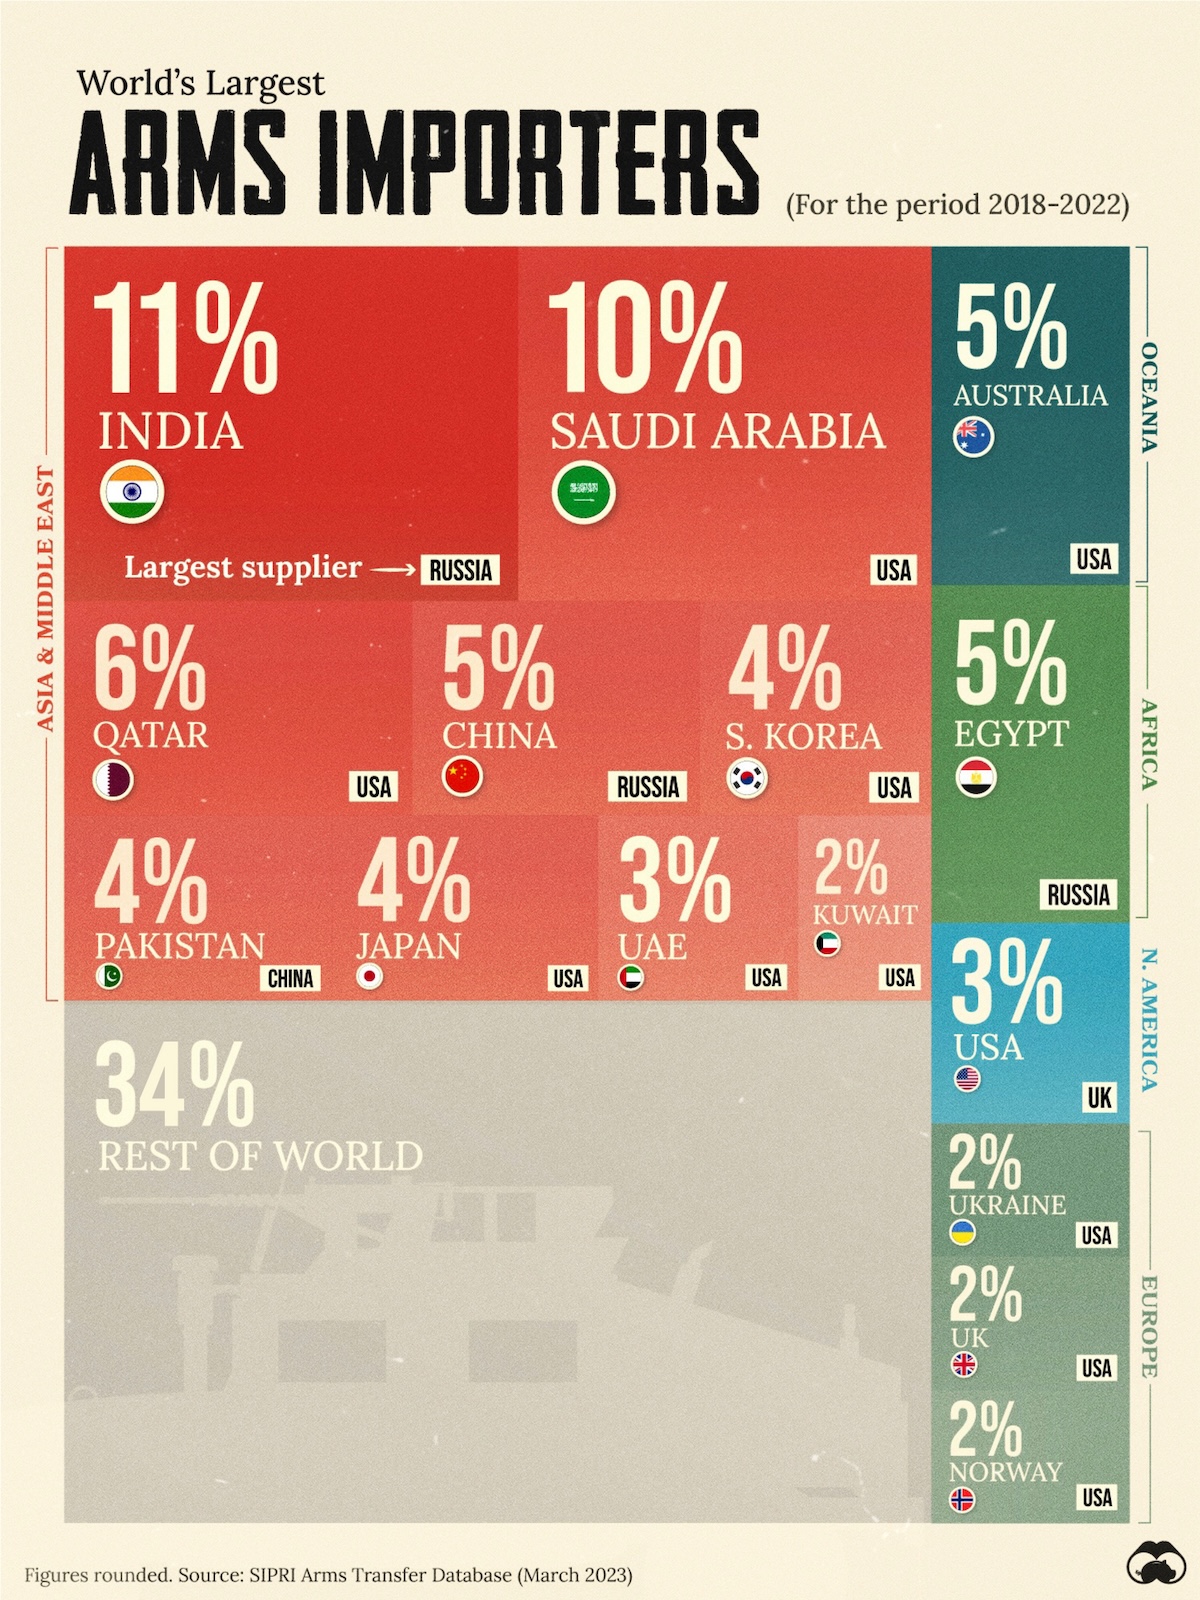
Ranked: Share of Global Arms Imports in 2022
Ranked: Share of Global Arms Imports in 2022
Countries spend an enormous amount on their militaries, both to secure national interests and maintain their sovereignties.
A huge part of that goes toward acquiring new arms and equipment, often from other nations, as weapons manufacturing becomes extremely sophisticated and specialized.
We highlight the countries with the biggest share of of global arms imports in 2018–2022, using data from the Stockholm International Peace Research Institute (SIPRI).
Which Country Imports the Most Weapons?
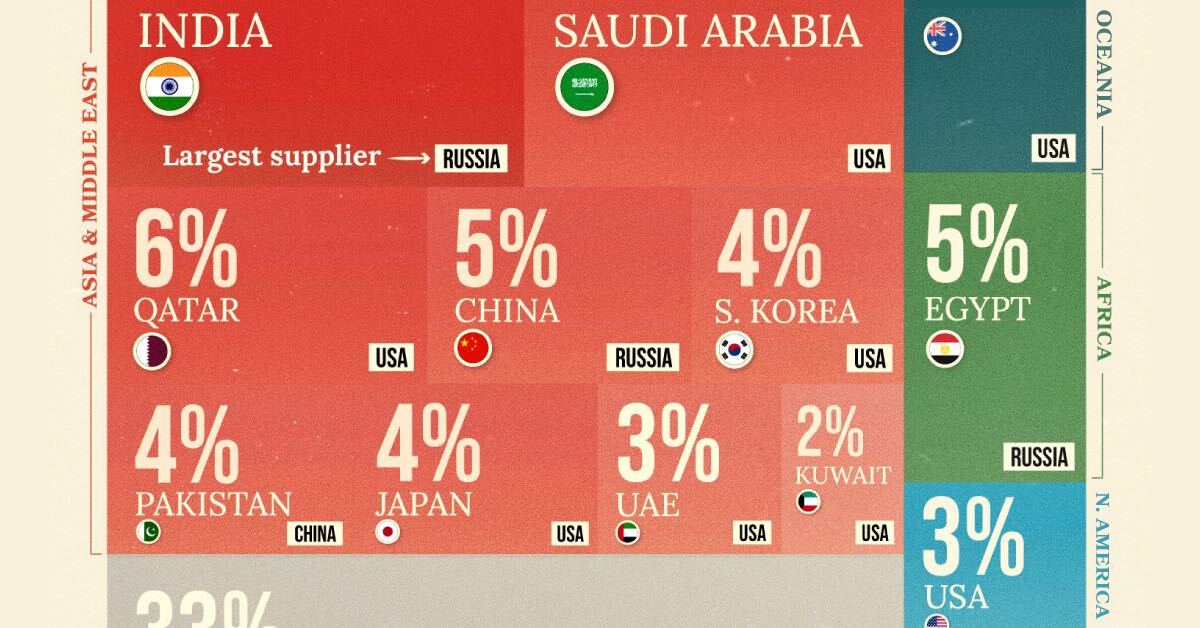
India ranks first in having the biggest share of global arms imports at 11% in the time period between 2018–2022. The world’s fifth biggest economy has the fourth-biggest military budget and relies on Russia to supply most of its foreign arms needs, followed by France and the U.S.
| Country | % Share of Global Arms Imports (2018-2022) | Largest Supplier |
|---|---|---|
| 🇮🇳 India | 11% | 🇷🇺 Russia |
| 🇸🇦 Saudi Arabia | 10% | 🇺🇸 U.S. |
| 🇶🇦 Qatar | 6% | 🇺🇸 U.S. |
| 🇦🇺 Australia | 5% | 🇺🇸 U.S. |
| 🇨🇳 China | 5% | 🇷🇺 Russia |
| 🇪🇬 Egypt | 5% | 🇷🇺 Russia |
| 🇰🇷 South Korea | 4% | 🇺🇸 U.S. |
| 🇵🇰 Pakistan | 4% | 🇨🇳 China |
| 🇯🇵 Japan | 4% | 🇺🇸 U.S. |
| 🇺🇸 U.S. | 3% | 🇬🇧 UK |
| 🇦🇪 UAE | 3% | 🇺🇸 U.S. |
| 🇰🇼 Kuwait | 2% | 🇺🇸 U.S. |
| 🇬🇧 UK | 2% | 🇺🇸 U.S. |
| 🇺🇦 Ukraine | 2% | 🇺🇸 U.S. |
| 🇳🇴 Norway | 2% | 🇺🇸 U.S. |
| 🌐 Rest of World | 34% | N/A |
From the Middle East, Saudi Arabia (10%) and Qatar (6%) rank as the second and third-largest importers of weapons, both benefiting from the U.S. as their biggest military trade partner.
Australia, China, and Egypt are all at 5%, with the former primarily supplied by the U.S. while the latter two by Russia. In fact, the U.S. and Russia are the primary sources of arms for 13 of the top 16 countries by share of global arms imports.
Naturally, the two countries are the world’s biggest exporters of military equipment, accounting for 56% of arms exports by volume.
How Arms Imports Align with Geopolitical Events and Alliances
The list of biggest arms importers is also a shorthand for geopolitical hotspots and tense border situations in the world. The India-China-Pakistan trifecta has three nuclear-powered nations in close proximity with each other, with border skirmishes between India and its western and eastern neighbour occurring semi-regularly in the last decade.
Four Middle Eastern nations—incidentally all supplied by the U.S.—speak to attempts to counter Iran’s influence in the region. Meanwhile Australia, Japan and South Korea are bolstering their forces amidst rising tensions with China and North Korea.
With the UK, Ukraine, and Norway rounding out the top 15, the spillover from the Russian invasion—in Ukraine’s case, being the target of the invasion—is also seen clearly.


Demographics
Ranked: Countries Where Youth are the Most Unhappy, Relative to Older Generations
Conventional wisdom says that young adults (those below 30) tend to be the happiest demographic—but this is not true for these countries.
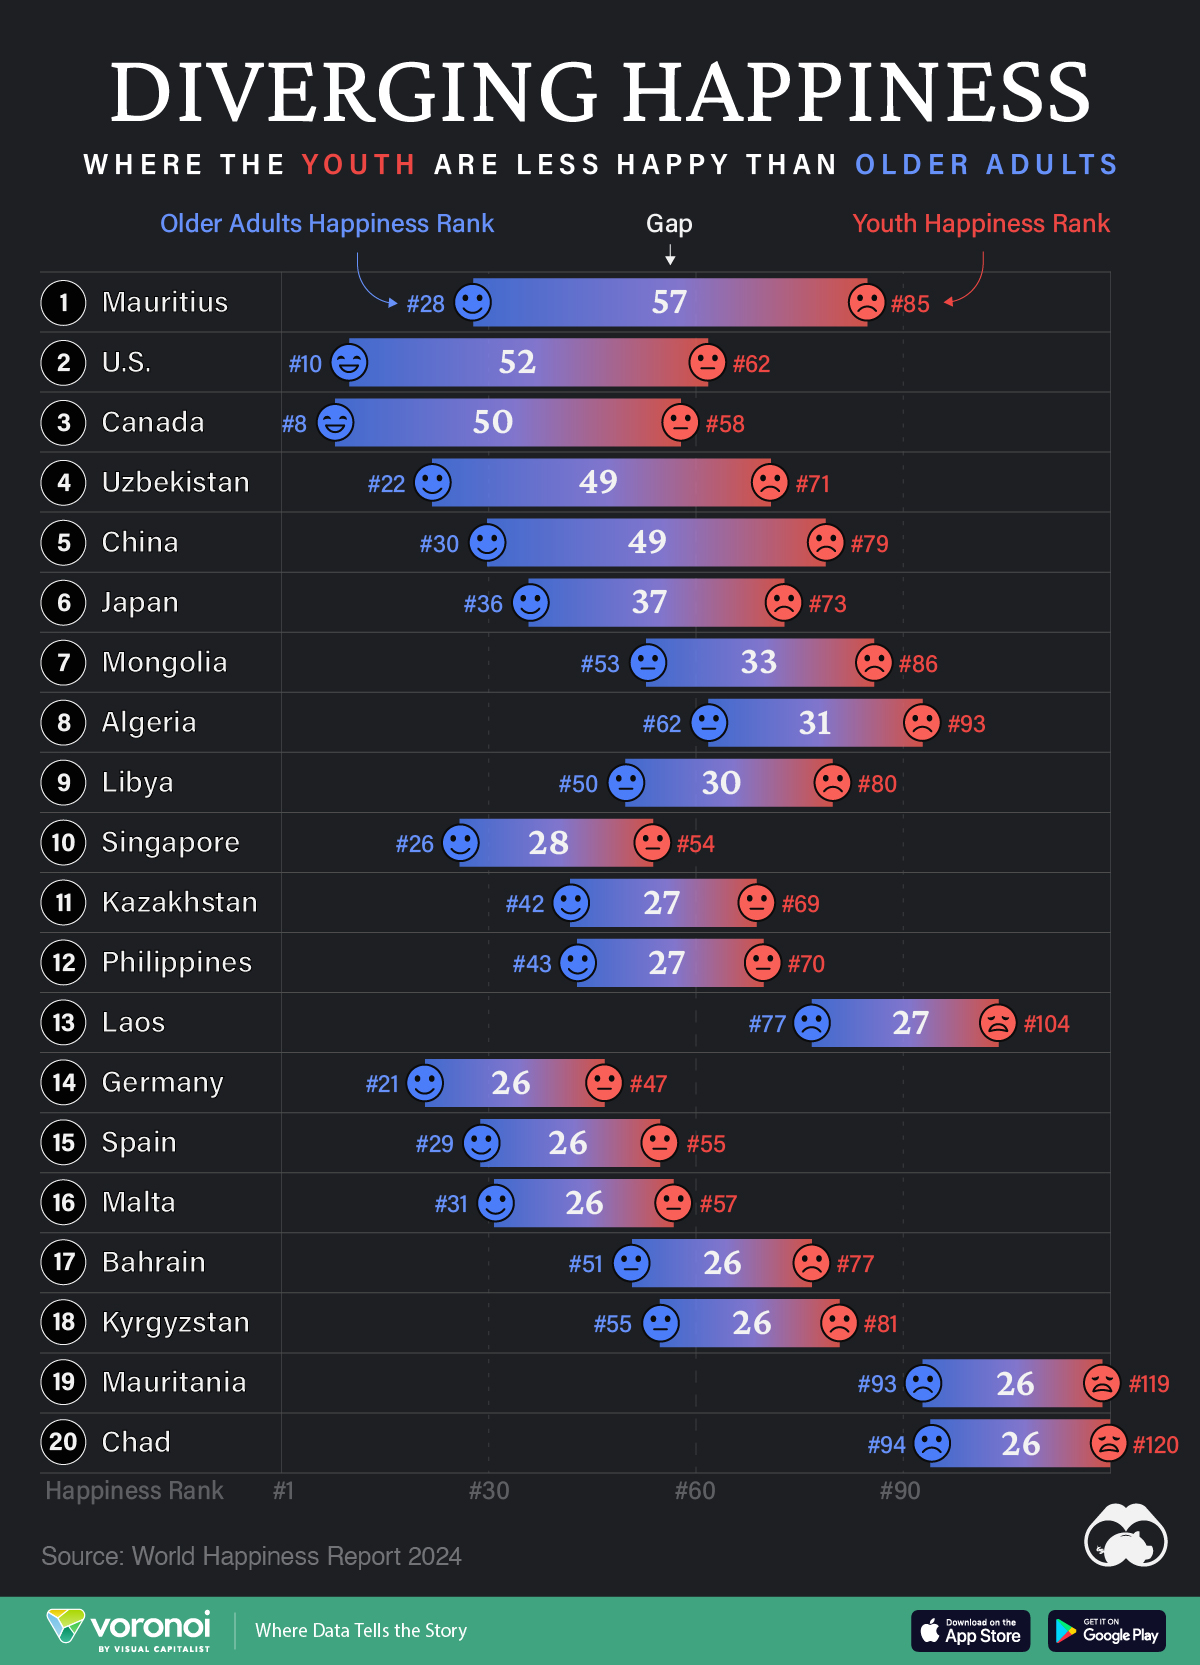
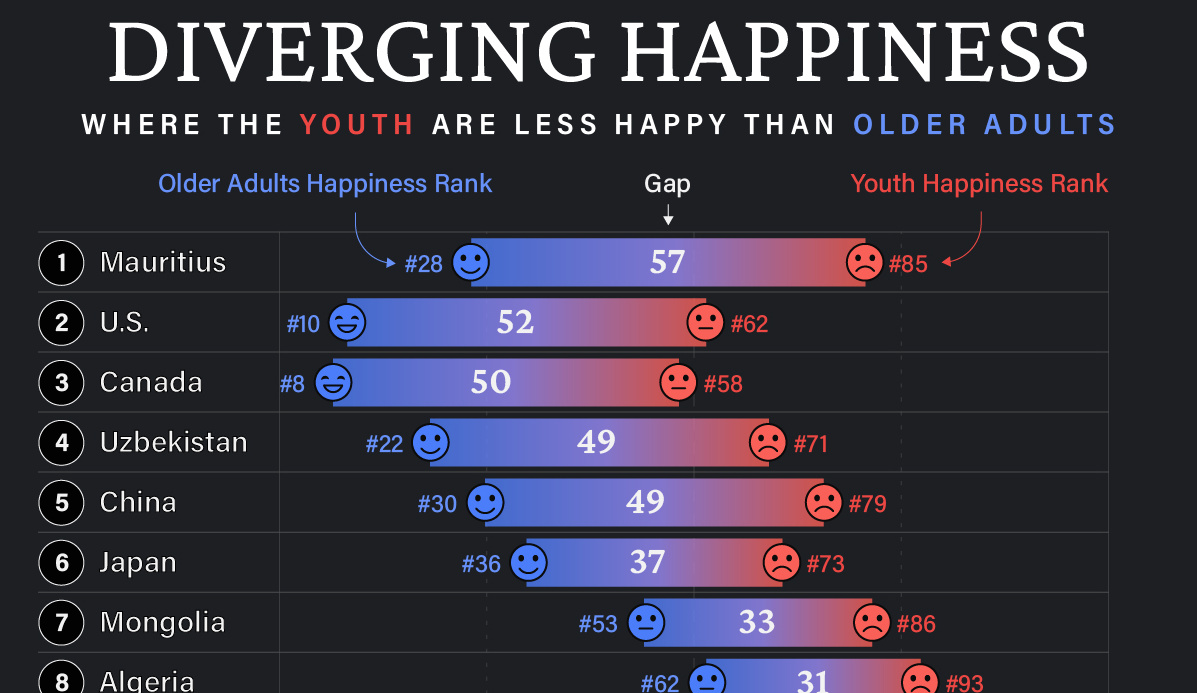
Countries with the Biggest Happiness Gaps Between Generations
This was originally posted on our Voronoi app. Download the app for free on iOS or Android and discover incredible data-driven charts from a variety of trusted sources.
“They say a person needs just three things to be truly happy in this world: someone to love, something to do, and something to hope for.” — Tom Bodett
Measuring happiness is tricky business, more so when taking into account how different regions, cultures, and faiths define it. Nevertheless, the World Happiness Report attempts to distill being happy into a single score out of 10, and then ranks countries by their average score.
We’ve visualized the high-level findings from the latest happiness report in this series of maps. However, the report also dives deeper into other significant trends in the data, such as a growing disparity in happiness between age groups within countries themselves.
In the chart above, we list countries by the biggest gaps in happiness ranks between young adults (<30) and older adults (60+). A higher number indicates a larger gap, and that the youth are far unhappier than their older counterparts.
Where are Youth Unhappier than Older Adults?
Mauritius ranks first on this list, with a massive 57 place gap between older adult and youth happiness. The 1.26 million-inhabited island nation briefly reached high income status in 2020, but the pandemic hit hard, hurting its key tourism sector, and affecting jobs.
The country’s youth unemployment rate spiked to close to 25% that year, but has since been on the decline. Like residents on many similarly-populated islands, the younger demographic often moves abroad in search of more opportunities.
| Rank | Country | Youth Happiness Rank | Older Adult Happiness Rank | Happiness Gap |
|---|---|---|---|---|
| 1 | 🇲🇺 Mauritius | 85 | 28 | 57 |
| 2 | 🇺🇸 U.S. | 62 | 10 | 52 |
| 3 | 🇨🇦 Canada | 58 | 8 | 50 |
| 4 | 🇺🇿 Uzbekistan | 71 | 22 | 49 |
| 5 | 🇨🇳 China | 79 | 30 | 49 |
| 6 | 🇯🇵 Japan | 73 | 36 | 37 |
| 7 | 🇲🇳 Mongolia | 86 | 53 | 33 |
| 8 | 🇩🇿 Algeria | 93 | 62 | 31 |
| 9 | 🇱🇾 Libya | 80 | 50 | 30 |
| 10 | 🇸🇬 Singapore | 54 | 26 | 28 |
| 11 | 🇰🇿 Kazakhstan | 69 | 42 | 27 |
| 12 | 🇵🇭 Philippines | 70 | 43 | 27 |
| 13 | 🇱🇦 Laos | 104 | 77 | 27 |
| 14 | 🇩🇪 Germany | 47 | 21 | 26 |
| 15 | 🇪🇸 Spain | 55 | 29 | 26 |
| 16 | 🇲🇹 Malta | 57 | 31 | 26 |
| 17 | 🇧🇭 Bahrain | 77 | 51 | 26 |
| 18 | 🇰🇬 Kyrgyzstan | 81 | 55 | 26 |
| 19 | 🇲🇷 Mauritania | 119 | 93 | 26 |
| 20 | 🇹🇩 Chad | 120 | 94 | 26 |
Conventional wisdom says, and data somewhat correlates, that young adults (those below 30) tend to be the happiest demographic. Happiness then decreases through middle age and starts increasing around 60. However, the above countries are digressing from the pattern, with older generations being much happier than young adults.
That older generations are happier, by itself, is not a bad thing. However, that younger adults are so much unhappier in the same country can point to several unique stresses that those aged below 30 are facing.
For example, in the U.S. and Canada—both near the top of this list—many young adults feel like they have been priced out of owning a home: a once key metric of success.
Climate anxieties are also high, with worries about the future of the world they’ll inhabit. Finally, persistent economic inequities are also weighing on the younger generation, with many in that cohort feeling like they will never be able to afford to retire.
All of this comes alongside a rising loneliness epidemic, where those aged 18–25 report much higher rates of loneliness than the general population.
Source: The World Happiness Report which leverages data from the Gallup World Poll.
Methodology: A nationally representative group of approximately 1,000 people per country are asked to evaluate their life on a scale of 0–10. Scores are averaged across generations per country over three years. Countries are ranked by their scores out of 10.

-

 Maps7 days ago
Map: Where Are America’s Largest Landfills?
-

 Finance2 weeks ago
Ranked: The World’s 50 Largest Private Equity Firms
-

 Maps2 weeks ago
Mapped: The 10 U.S. States With the Lowest Real GDP Growth
-

 China2 weeks ago
Comparing New and Current U.S. Tariffs on Chinese Imports
-

 Politics2 weeks ago
Which Countries Have the Most Economic Influence in Southeast Asia?
-

 Misc2 weeks ago
The Top 25 Nationalities of U.S. Immigrants
-

 Demographics2 weeks ago
Ranked: Countries Where Youth are the Most Unhappy, Relative to Older Generations
-

 Technology2 weeks ago
Visualizing the 5 Most Common Cybersecurity Mistakes